Advanced Risk Parity: Building Truly Risk-Balanced Crypto Portfolios
Learn how to build risk-balanced crypto portfolios using Sortino Ratio, Beta Tracker, and Relative Strength Peers indicators for systematic allocation.
Profabighi Capital Research Team
January 24, 2026
Trading Risk Warning
Trading Risk Warning: Trading involves substantial risk of loss and is not suitable for all investors. Past performance does not guarantee future results. You should carefully consider your financial situation and consult with financial advisors before making any investment decisions.
Most crypto traders make a critical mistake: they think equal dollar allocation means equal risk. It doesn't.
A 10% allocation to a high-volatility altcoin might contribute 40% of your portfolio's total risk, while a 10% allocation to Bitcoin contributes only 15%. Your portfolio performance becomes dominated by whatever happens to explode—or implode—regardless of your carefully planned weights.
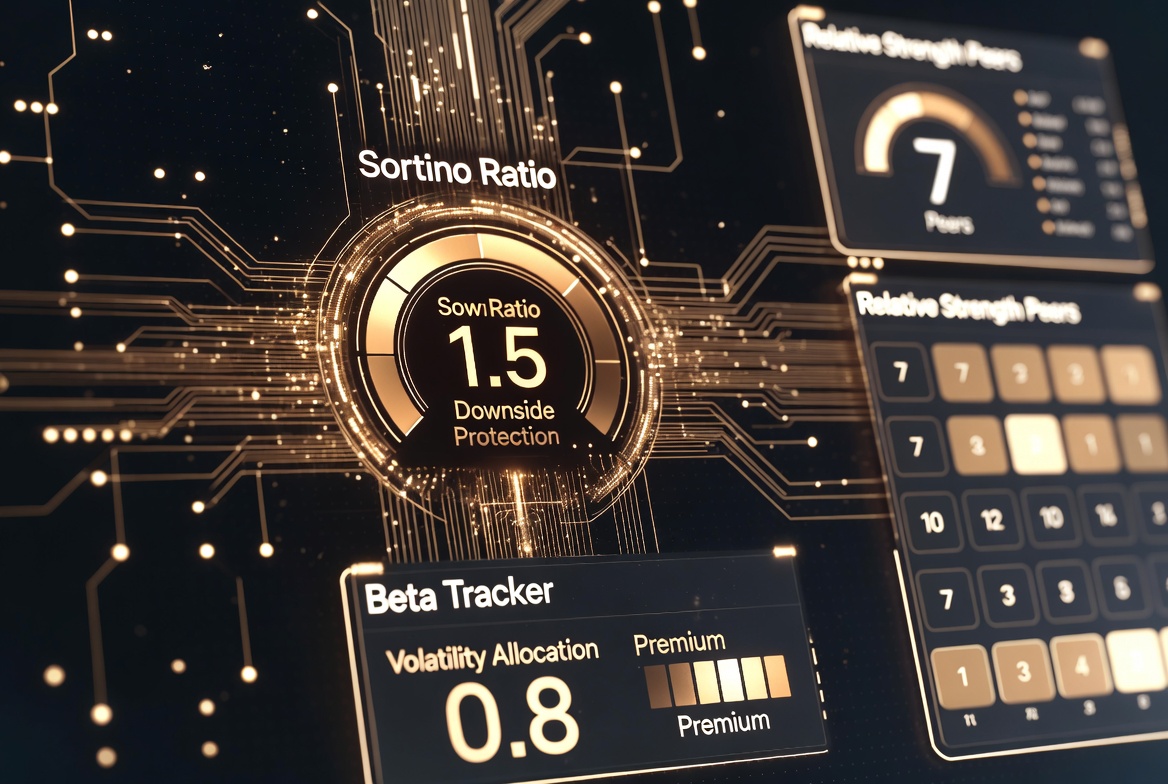
The Advanced Risk Parity Framework solves this by combining three complementary indicators: Sortino Ratio (downside risk measurement), Beta Tracker (volatility and market correlation), and Relative Strength Peers (opportunity quality identification). Together, they create portfolios where each position contributes equally to total risk while systematically selecting the highest-quality opportunities.
The Problem with Traditional Allocation
Traditional portfolio construction uses either equal-weight or market-cap-weight allocation. Both create hidden risk concentration.
Equal-weight example:
- BTC: 20% allocation, Beta 1.0, contributes ~15% of portfolio risk
- SOL: 20% allocation, Beta 1.4, contributes ~28% of portfolio risk
- DOGE: 20% allocation, Beta 1.8, contributes ~36% of portfolio risk
Despite "equal" allocation, DOGE dominates your risk profile. When DOGE crashes, your portfolio crashes—even though you thought you were diversified.
The solution: Allocate based on risk contribution, not dollar amounts.
The Three-Indicator Framework
Indicator 1: Sortino Ratio — Measuring What Actually Matters
The Sortino Ratio focuses exclusively on downside risk. Unlike Sharpe Ratio (which penalizes both gains and losses), Sortino only counts volatility that hurts you.
From the Profabighi Capital Sortino Ratio indicator:
The formula calculates periodic returns, then isolates only the negative deviations from your target return (typically 0% or risk-free rate). The downside deviation is the standard deviation of these negative returns only.
Formula:
Sortino = (Mean Return - Target Return) / Downside DeviationKey thresholds from the indicator:
- Strong Line (>1.0): Excellent downside protection — green zone
- Weak Line (<0.0): Poor downside protection — red zone
- Between: Neutral territory — gray zone
The indicator uses a 90-day calculation period with EMA smoothing (default 3 periods) to reduce noise while maintaining responsiveness.
Why Sortino matters for risk parity:
In crypto, we want asymmetric returns—big gains, small losses. Sortino captures this by ignoring upside volatility. An asset with high upside swings but controlled downside gets a high Sortino, making it ideal for risk parity inclusion.
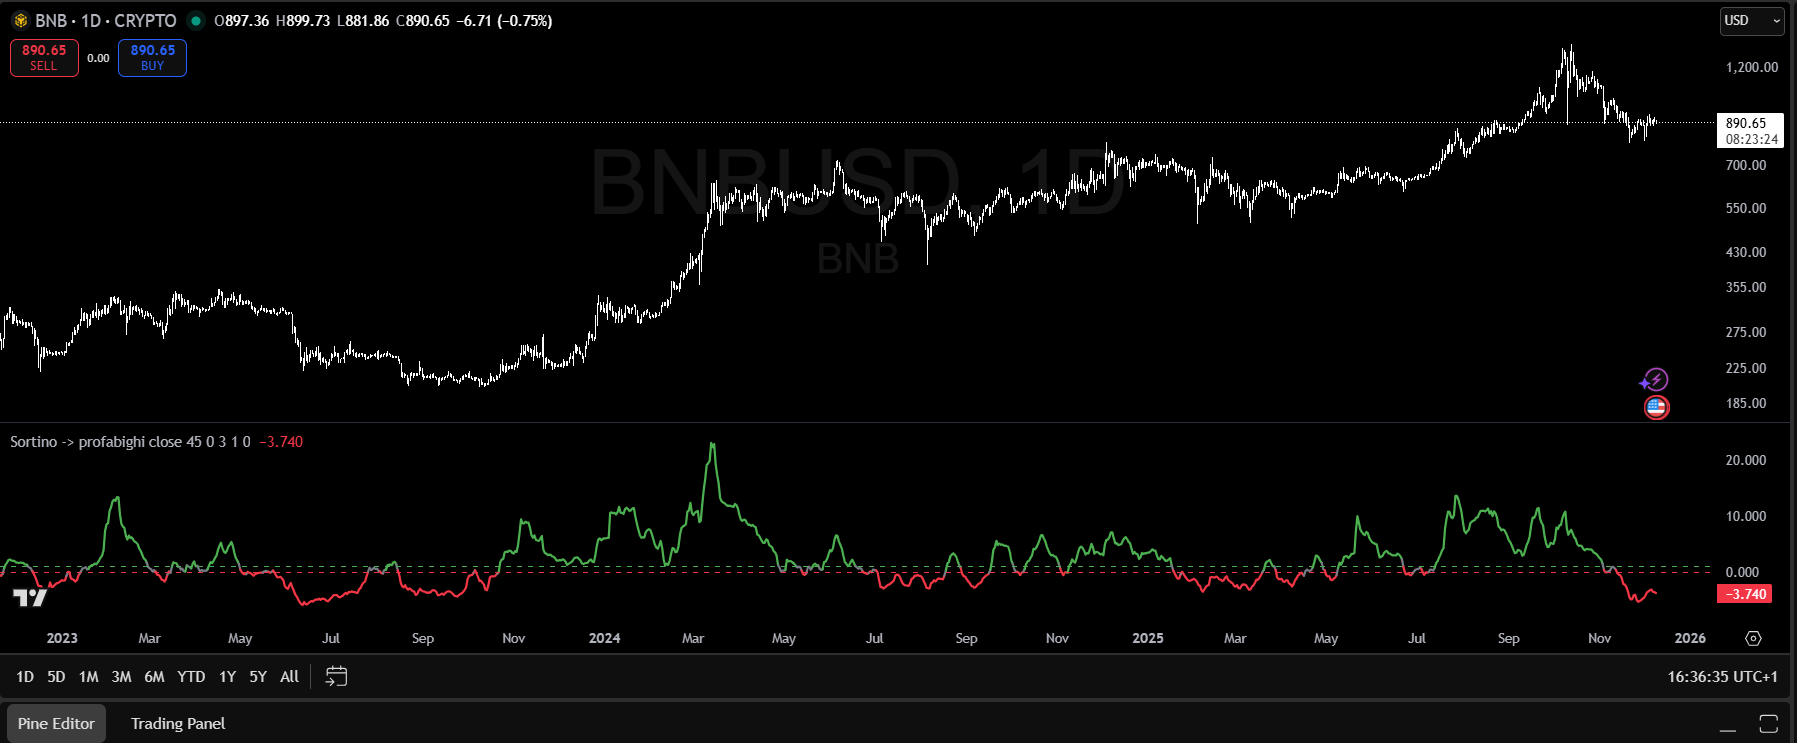
The Sortino Ratio indicator displays the risk-adjusted performance value as a color-coded line. Key thresholds: values above 1.0 turn green (Strong zone), values below 0.0 turn red (Weak zone), values between 0-1.0 appear gray (Neutral). The line can spike to high values during strong momentum phases, but the decision thresholds remain at 1.0 and 0.0. Current reading shown: -3.740 (red/weak zone).
Indicator 2: Beta Tracker — Quantifying Market Sensitivity
Beta measures how an asset moves relative to the overall market. The Profabighi Capital Beta Tracker calculates this against CRYPTOCAP:TOTAL (total crypto market cap).
From the indicator:
Beta = Covariance(Asset Returns, Benchmark Returns) / Variance(Benchmark Returns)The indicator uses a 30-day lookback period by default and tracks up to 33 assets simultaneously, displaying them in a color-coded table.
Beta interpretation:
- Beta < 0.7: Low beta regime — asset moves less than market
- Beta 0.7-1.3: Medium beta regime — asset moves with market
- Beta > 1.3: High beta regime — asset moves more than market
Additional features:
- Beta Momentum: Rate of change in beta over time (optional)
- Regime Classification: L (Low), M (Medium), H (High) labels
- Median Comparison: Emoji indicators (🚀 above median, 📉 below)
Why Beta matters for risk parity:
Position sizing must account for volatility. A high-beta asset (1.4) needs smaller allocation than a low-beta asset (0.7) to contribute equal risk.
![]()
The Beta Tracker displays a comprehensive table of 30+ assets with real-time beta coefficients. Color coding: bright green = high beta (>1.3), neutral = medium beta (0.7-1.3), red = low/negative beta. The "Top Assets" box (left) ranks the highest-beta assets. The "Beta Median" display (right) shows the median beta across all tracked assets (1.31 in this screenshot). H/M/L regime labels classify each asset's volatility profile. Emoji indicators: 🚀 = above median beta, 📉 = below median beta.
Indicator 3: Relative Strength Peers — Finding Quality Opportunities
The Relative Strength Peers indicator compares assets against their peer group using RSI-based scoring. It answers: "Which assets are outperforming their peers right now?"
From the indicator:
The indicator calculates RSI for each asset's price ratio against every other asset in the peer group. If Asset A's RSI vs Asset B is above 50, Asset A scores a point. Total score = how many peers the asset is outperforming.
Key features:
- Tracks up to 40 assets simultaneously
- Optional MA smoothing (SMA, EMA, WMA, HMA, RMA, LSMA, DEMA, TEMA, VIDYA)
- Emoji matrix: 🚀 rockets for wins, 📉 arrows for losses
- Separate "Top Assets" table showing leaders with points
Why RS matters for risk parity:
Risk parity alone doesn't guarantee quality. You could have perfectly balanced risk across mediocre assets. RS filtering ensures you're allocating risk to assets that are actually outperforming—leaders, not laggards.
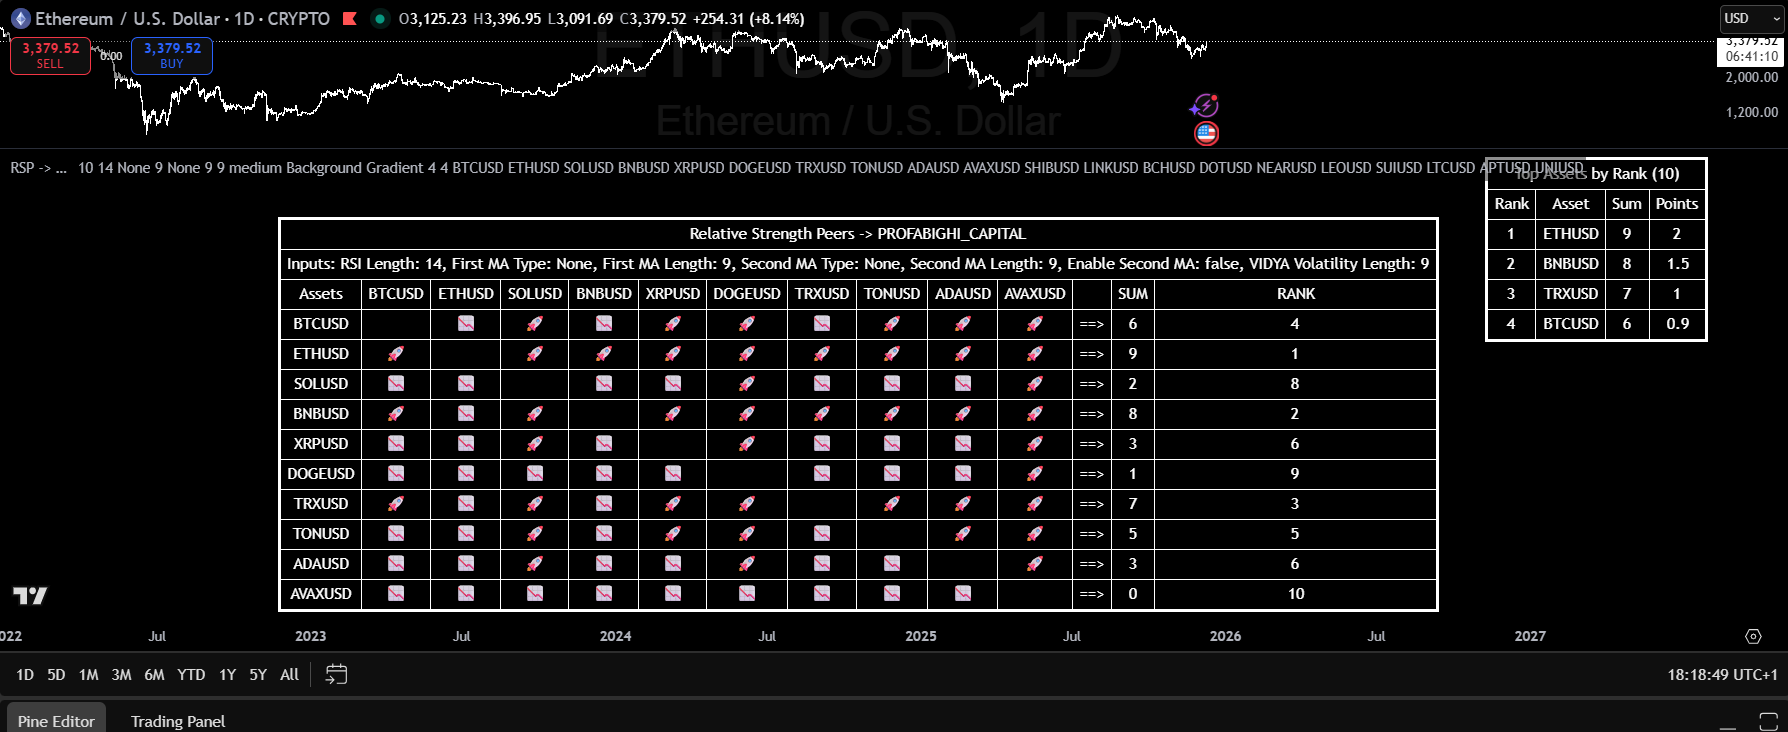
The RS Peers indicator displays a pairwise comparison matrix where each asset is evaluated against every other asset using RSI-based scoring. Rocket emoji (🚀) indicate relative strength (outperforming that peer), while stocks-down arrow emoji (📉) indicate relative weakness (underperforming that peer). The "Sum" column shows total wins (0-9 in a 10-asset universe). The "Rank" column shows hierarchy position (1 = strongest). The "Points" column provides weighted scoring (2.0 for rank 1, 1.5 for rank 2, etc.).
Practical Decision Framework
Instead of complex calculations, use the three indicators as a simple decision filter:
Step 1: Quality Filter (Relative Strength Peers)
Open the RS Peers indicator and look at the "Top Assets" table:
- Include: Assets with high scores (more 🚀 rockets in the matrix = outperforming more peers)
- Exclude: Assets with low scores (more 📉 arrows = underperforming peers)
The ranking shows how many peers each asset is beating. Higher rank = stronger relative performance.
Step 2: Risk Filter (Sortino Ratio)
For each asset that passed Step 1, check the Sortino Ratio indicator:
- Above Strong threshold (>1.0): Good downside protection (line turns green) → Include
- Between thresholds (0 to 1.0): Neutral (line turns gray) → Consider with caution
- Below Weak threshold (<0.0): Poor downside protection (line turns red) → Exclude
Step 3: Position Sizing (Beta Tracker)
Use Beta to adjust position sizes. The principle is simple: higher beta = smaller position.
Look at the Beta Tracker table for each asset:
- Low Beta (<0.7): Can take larger position (asset is less volatile than market)
- Medium Beta (0.7-1.3): Standard position size
- High Beta (>1.3): Take smaller position (asset is more volatile than market)
Simple sizing rule:
- Base position: 10% per asset
- Low Beta: Can go up to 15%
- High Beta: Reduce to 5-7%
Step 4: Final Checklist
Before adding an asset to your portfolio:
- ✅ RS Peers: High score in the ranking? (check Top Assets table)
- ✅ Sortino: Above Strong threshold (>1.0)?
- ✅ Beta: Acceptable level (<1.5)?
If all three pass → Add to portfolio with Beta-adjusted sizing.
When to Rebalance
Check your indicators weekly and rebalance when:
Relative Strength changes:
- Asset drops from top half to bottom half → Consider removing
- New asset enters top performers → Consider adding
Sortino crosses threshold:
- Drops below Weak threshold (<0.0) → Remove or reduce
- Rises above Strong threshold (>1.0) → Consider adding
Beta regime shifts:
- Look for the L/M/H labels in Beta Tracker
- M→H transition (medium to high): Reduce position size
- H→M transition (high to medium): Can increase position size
Dynamic Rebalancing Triggers
Risk parity isn't set-and-forget. Check your indicators weekly and rebalance when:
Trigger 1: Relative Strength Change
- Asset drops from top half to bottom half of RS ranking → Consider removing
- New asset enters top performers → Consider adding
Trigger 2: Sortino Threshold Crossing
- Drops below Weak threshold (<0.0) → Remove or reduce position
- Rises above Strong threshold (>1.0) → Consider adding
Trigger 3: Beta Regime Shift
- Look for the L/M/H labels in Beta Tracker
- M→H transition (medium to high): Reduce position size
- H→M transition (high to medium): Can increase position size
Monthly minimum review for all positions regardless of triggers.
Practical Implementation
Weekly Monitoring Checklist
Using the three Profabighi Capital indicators:
1. Check Sortino Ratio indicator:
- Which assets are above Strong threshold (>1.0)?
- Which assets are below Weak threshold (<0.0)?
- Any assets crossing thresholds?
2. Check Beta Tracker:
- Review the median beta of your holdings
- Identify assets with 🚀 (above median) vs 📉 (below median)
- Check regime classifications (L/M/H)
3. Check Relative Strength Peers:
- Review the "Top Assets" table for leaders
- Check the emoji matrix: 🚀 = outperforming, 📉 = underperforming
- Which of your holdings have high scores (beating many peers)?
Monthly Rebalancing Process
- Open all three indicators on TradingView
- Check RS Peers: Any holdings dropped out of top performers?
- Check Sortino: Any holdings crossed below Strong threshold (>1.0)?
- Check Beta Tracker: Any regime changes (L→M→H)?
- Adjust positions based on current Beta values
- Execute trades to rebalance
When Risk Parity Works Best
Ideal conditions:
- Trending markets with clear leaders
- Moderate correlation between assets
- Sufficient liquidity for rebalancing
- Weekly or monthly rebalancing capacity
Challenging conditions:
- Highly correlated crash scenarios (all assets move together)
- Extremely low volatility periods (small differences in risk)
- Illiquid assets (rebalancing costs eat returns)
- Rapid regime changes (indicators lag)
Key Principles
Equal dollars ≠ equal risk. A 10% allocation to a high-beta asset contributes more risk than 10% to a low-beta asset.
Sortino focuses on what matters. Downside deviation captures the risk you actually care about—losses, not gains.
Beta quantifies market sensitivity. Use it to size positions appropriately for their volatility contribution.
Relative Strength ensures quality. Risk parity across weak assets is still a weak portfolio. Filter first, then allocate.
Systematic rebalancing maintains balance. Risk contributions drift over time. Regular rebalancing keeps the framework effective.
FAQ
Q: How often should I rebalance?
A: Monthly minimum, or when indicators show significant changes (RS ranking drops, Sortino crosses threshold, Beta regime shifts). More frequent rebalancing improves risk balance but increases transaction costs.
Q: What if all my assets fail the quality filters?
A: Increase cash allocation. Risk parity with no quality assets is worse than holding cash. Wait for opportunities to emerge.
Q: Can I use this for traditional assets too?
A: Yes, but adjust the Beta Tracker benchmark (use SPY instead of TOTAL) and consider different Sortino thresholds for lower-volatility assets.
Q: How do I handle highly correlated assets?
A: If two assets move together, reduce the lower-RS asset and reallocate to less correlated alternatives. The RS Peers indicator helps identify which asset is stronger.
Q: What's the minimum number of assets for risk parity?
A: At least 5-7 assets for meaningful diversification. Fewer assets means each position has outsized impact on portfolio risk.
Disclaimer: This content is educational only and does not constitute financial advice. Trading cryptocurrencies involves substantial risk of loss. Past performance does not guarantee future results. Always conduct your own research and consider your risk tolerance before trading.