Dynamic Beta Management: Systematic Exposure Control for Crypto Portfolios
Master portfolio beta management with real-time exposure adjustment using Beta Tracker, Delta Pro, and RATIOS indicators.
Profabighi Capital Research Team
January 19, 2026
Trading Risk Warning
Trading Risk Warning: Trading involves substantial risk of loss and is not suitable for all investors. Past performance does not guarantee future results. You should carefully consider your financial situation and consult with financial advisors before making any investment decisions.
Static portfolio beta fails in dynamic markets. When volatility spikes, fixed exposure amplifies losses. When opportunities emerge, conservative positioning leaves gains on the table.
The Dynamic Beta Management System solves this by combining three indicators—Beta Tracker, Delta Pro, and RATIOS—into a unified framework that adjusts target beta based on market regime, momentum signals, and asset quality.
The Problem with Static Beta
Most portfolio managers assign a target beta and maintain it regardless of market conditions. A portfolio with beta of 1.2 keeps that exposure whether momentum is extreme or neutral, whether asset quality is improving or deteriorating.
This approach ignores three critical information sources:
Market Regime: Bull markets reward higher beta. Bear markets punish it. Neutral markets require different positioning than either extreme.
Price Momentum: When momentum reaches extremes, maintaining aggressive positioning increases risk. Overbought conditions often precede pullbacks.
Asset Quality: High beta in deteriorating assets amplifies losses without proportional upside. Quality matters as much as exposure level.
Understanding Portfolio Beta
Beta quantifies how an asset moves relative to a benchmark. The calculation uses covariance (how asset and benchmark move together) divided by variance (how much the benchmark moves on its own).
Beta = Covariance(Asset, Benchmark) / Variance(Benchmark)
Interpretation:
- Beta > 1.0: Asset moves more than benchmark (amplified exposure)
- Beta = 1.0: Asset moves with benchmark (market-matching)
- Beta < 1.0: Asset moves less than benchmark (dampened exposure)
- Beta < 0: Asset moves opposite to benchmark (inverse correlation)
Portfolio beta aggregates individual position betas weighted by allocation:
Portfolio Beta = Σ(Position Beta × Position Weight)
The Three-Indicator Framework
Layer 1: Beta Tracker — Exposure Intelligence
Beta Tracker calculates real-time beta values for up to 33 cryptocurrency assets against a configurable benchmark (default: CRYPTOCAP:TOTAL). It uses proper statistical methodology: covariance divided by variance over a rolling window.
Key Features:
Multi-Asset Beta Dashboard: See beta values for your entire watchlist simultaneously in a color-coded table. Green indicates high beta, red indicates low beta, with gradient coloring based on configurable neutral value and range.
Beta Regime Classification: Assets are categorized based on configurable thresholds:
- L (Low Beta): Beta < 0.7 — defensive positioning
- M (Medium Beta): Beta 0.7-1.3 — market-matching
- H (High Beta): Beta > 1.3 — amplified exposure
Beta Momentum (optional feature): Measures the rate of change in beta over time. Rising beta momentum indicates strengthening market correlation—potentially signaling regime transition.
Warning system:
- Orange indicator: Beta is accelerating at a notable rate
- Red indicator: Regime shift may be imminent
![]()
Beta Tracker displaying real-time beta coefficients for 30+ crypto assets. The scrolling ticker shows all tracked pairs (ETHUSD, XRPUSD, BNBUSD, SOLUSD, etc.). Left panel ranks top 5 highest-beta assets. Center grid displays color-coded beta values: green (>1.0 high beta), orange (0.8-1.0 moderate), red (<0.8 low beta). Right panel shows median beta (1.309 in this example). Assets like SUIUSD (2.221) and PEPEUSD (2.056) exhibit amplified market sensitivity, while BCHUSD (0.837) and XMRUSD (0.655) show defensive characteristics.
Layer 2: Delta Pro — Momentum Signal
Delta Pro measures price momentum through multiple lenses:
Price Delta: The core calculation measures price change over a configurable period:
price_delta = source - source[period]Positive values indicate upward momentum, negative values indicate downward momentum.
RSI of Price Delta: Applying RSI to the price delta creates a bounded momentum oscillator (0-100 scale):
- RSI > 70: Overbought momentum—price has been rising aggressively
- RSI 30-70: Neutral momentum zone
- RSI < 30: Oversold momentum—price has been falling aggressively
Volume Delta: Approximates buying vs selling pressure:
volume_delta = volume × sign(price_change)Positive volume delta suggests buying pressure; negative suggests selling pressure.
Cumulative Volume Delta (CVD): Running total of volume delta over time. Rising CVD indicates sustained accumulation; falling CVD indicates sustained distribution.
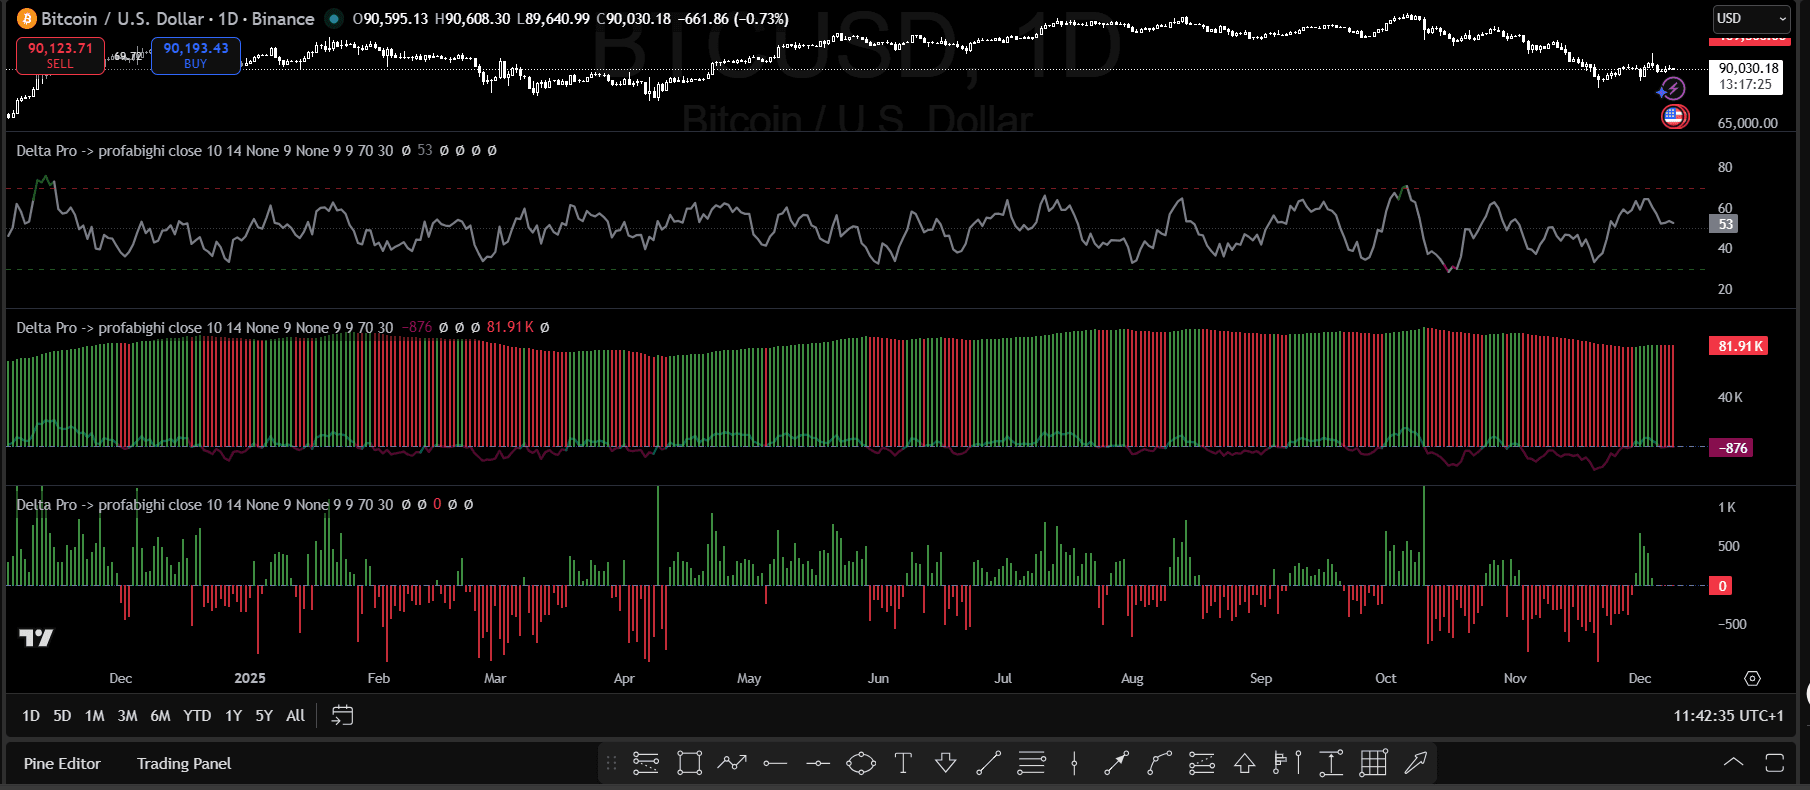
Delta Pro multi-panel display: Panel 2 shows RSI of Price Delta oscillating between 0-100 (green line), with readings >70 indicating overbought momentum and <30 indicating oversold. Panel 3 displays Cumulative Volume Delta (CVD) with green/red histogram bars—rising CVD confirms accumulation, falling CVD confirms distribution. Panel 4 shows per-bar Volume Delta with green spikes (buying pressure) and red spikes (selling pressure). CVD divergence from price provides early warning of trend exhaustion.
Layer 3: RATIOS — Quality Validation
RATIOS provides simultaneous visualization of three risk-adjusted performance metrics:
Sharpe Ratio: Returns relative to total volatility. Measures whether returns compensate for overall risk taken. Properly annualized with configurable risk-free rate.
Sortino Ratio: Returns relative to downside risk only. More relevant than Sharpe because investors care more about losses than upside volatility.
Omega Ratio: Probability-weighted gains versus losses relative to a target return. Captures the full distribution of returns rather than just mean and variance.
Each ratio has configurable threshold lines (strong and weak) with dynamic color-coding:
- Above strong threshold: Green — premium quality
- Between thresholds: Neutral zone
- Below weak threshold: Red — weak quality
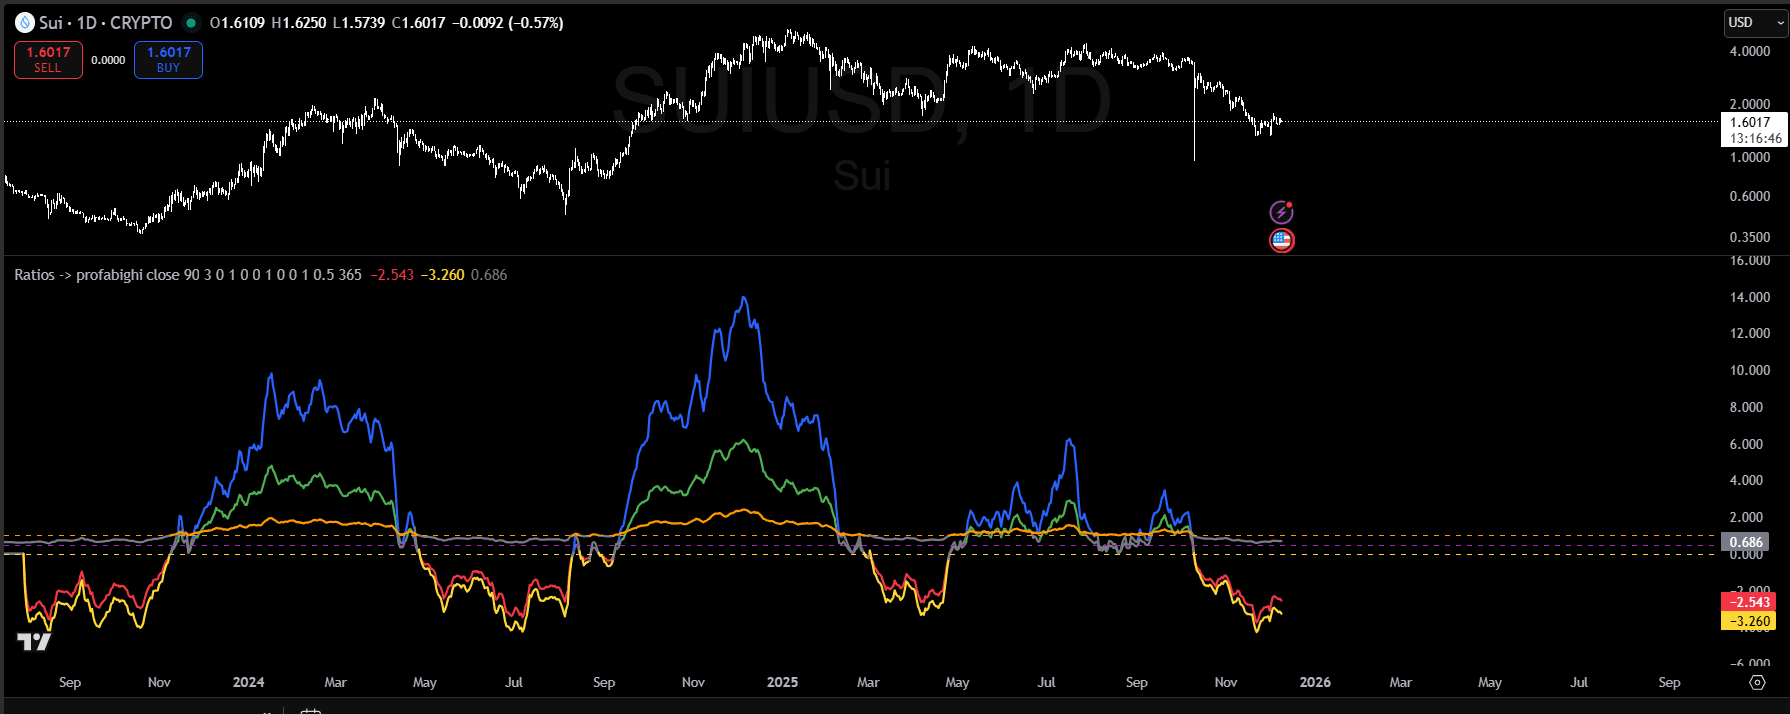
RATIOS indicator displaying three risk-adjusted performance metrics: Sortino Ratio (blue/yellow lines), Sharpe Ratio (green/red lines), and Omega Ratio (orange/purple lines). The horizontal dashed reference line marks the threshold separating healthy (above) from deteriorating (below) conditions. Extreme ratio spikes (e.g., Sortino reaching 14-15) can signal unsustainable performance—consider taking profits as mean reversion often follows. Ratio collapse below reference levels warns of regime shift.
The Dynamic Beta Formula
Target beta combines all three indicator signals:
Target Beta = Base Beta × Momentum Adjustment × Quality Multiplier
Base Beta by Market Regime
| Market Regime | Base Beta Range (Example) |
|---|---|
| Bull Market | 1.2-1.8 |
| Normal Market | 0.9-1.2 |
| Bear Market | 0.5-0.8 |
| Crisis | 0.2-0.5 |
Important: These ranges are examples only. Crypto markets tolerate higher beta than traditional markets—a beta of 1.8 during strong bull trends is reasonable for aggressive portfolios. Your optimal base beta depends on your risk tolerance, portfolio size, time horizon, and specific assets. Adjust these ranges based on your own backtesting and risk management rules.
Momentum Adjustment from Delta Pro
The RSI of Price Delta provides momentum context:
- RSI > 70: Reduce momentum factor to 0.85 (overbought, higher reversal risk)
- RSI 50-70: Momentum factor 1.0-1.1 (bullish but not extreme)
- RSI 30-50: Momentum factor 0.9-1.0 (bearish but not extreme)
- RSI < 30: Consider momentum factor 1.1 (oversold, potential bounce)
CVD direction provides confirmation:
- CVD rising + bullish RSI = stronger case for higher beta
- CVD falling + bearish RSI = stronger case for lower beta
- Divergence (CVD vs RSI) = caution, reduce conviction
Quality Multiplier from RATIOS
Assess the position of all three ratios relative to their strong threshold lines:
- All 3 ratios above strong thresholds: Quality Multiplier = 1.2
- 2 of 3 ratios above strong thresholds: Quality Multiplier = 1.0
- 1 or 0 ratios above strong thresholds: Quality Multiplier = 0.7
Practical Examples
Scenario A: Bull market, neutral momentum, excellent quality
- Base Beta: 1.5 (bull market, aggressive crypto portfolio)
- Momentum Adjustment: 1.0 (RSI at 55, neutral)
- Quality Multiplier: 1.2 (all 3 ratios above strong thresholds)
- Target Beta: 1.5 × 1.0 × 1.2 = 1.80
Scenario B: Normal market, bullish momentum, standard quality
- Base Beta: 1.1 (normal market)
- Momentum Adjustment: 1.05 (RSI at 60, bullish)
- Quality Multiplier: 1.0 (2 of 3 ratios above strong thresholds)
- Target Beta: 1.1 × 1.05 × 1.0 = 1.16
Scenario C: Bear market, oversold momentum, weak quality
- Base Beta: 0.6 (bear market)
- Momentum Adjustment: 1.1 (RSI at 25, oversold bounce potential)
- Quality Multiplier: 0.7 (only 1 ratio above strong threshold)
- Target Beta: 0.6 × 1.1 × 0.7 = 0.46
The differences are significant. Scenario A calls for aggressive positioning with high beta exposure. Scenario B maintains moderate exposure. Scenario C demands defensive positioning despite oversold conditions (quality filter overrides).
Rebalancing Triggers
The system monitors five trigger conditions:
Trigger 1: Beta Drift
Rebalance when |Current Beta - Target Beta| > 0.15. Check daily, execute when threshold breached.
Trigger 2: Regime Change
Rebalance immediately when market regime changes (bull→bear, etc.).
Trigger 3: Momentum Extreme
Review exposure when RSI of Price Delta crosses 70 or 30 thresholds.
Trigger 4: Quality Deterioration
Rebalance when any of the three ratios (Sharpe, Sortino, Omega) crosses below its weak threshold.
Trigger 5: Scheduled Review
Weekly review minimum. Monthly comprehensive rebalancing.
Common Mistakes to Avoid
Over-Adjusting Beta
Rebalancing on every small signal change creates excessive transaction costs. Set minimum adjustment thresholds (±0.15 beta) before executing trades.
Ignoring Transaction Costs
Frequent rebalancing erodes returns. Factor in trading costs and batch adjustments when possible.
Momentum Chasing
Don't increase beta just because momentum is positive. Extreme momentum (RSI > 70) often precedes pullbacks.
RATIOS Threshold Neglect
Adjusting beta based only on market signals ignores asset quality. Monitor all three ratios—when any falls below its weak threshold, reduce beta regardless of other signals.
Key Takeaways
Static beta exposure fails in dynamic markets. Fixed targets ignore valuable information about regime, momentum, and quality.
Beta Tracker provides the measurement foundation. Real-time beta calculation for 33 assets, regime classification (L/M/H), and optional beta momentum tracking.
Delta Pro provides momentum context. Price Delta measures raw momentum; RSI of Price Delta identifies extremes; CVD confirms accumulation/distribution.
RATIOS validates asset quality. Three ratios (Sharpe, Sortino, Omega) with threshold lines prevent increasing beta in deteriorating assets.
The formula combines all three: Target Beta = Base Beta × Momentum Adjustment × Quality Multiplier.
Transaction cost awareness preserves returns. Set minimum thresholds (±0.15 beta) and batch adjustments.
FAQ
Q: How often should I recalculate target beta?
A: Daily monitoring with weekly comprehensive review. Only execute adjustments when beta drift exceeds ±0.15 or a trigger condition is met.
Q: What benchmark should I use for crypto portfolios?
A: CRYPTOCAP:TOTAL (total crypto market cap) is the default. For altcoin-focused portfolios, consider CRYPTOCAP:TOTAL2 (excludes BTC) or CRYPTOCAP:TOTAL3 (excludes BTC and ETH).
Q: How do I handle correlation spikes during market stress?
A: During stress events, correlations spike and the system may lag. Consider pre-emptive beta reduction when VIX-equivalent indicators show elevated fear, rather than waiting for the system to catch up.
Q: What if the three indicators give conflicting signals?
A: Quality filter (RATIOS) takes precedence. If any ratio is below its weak threshold, reduce beta regardless of bullish momentum or regime signals.
Q: Is this system suitable for day trading?
A: No. The system is designed for portfolio-level exposure management with weekly rebalancing. Transaction costs make it unsuitable for frequent trading.
Disclaimer: This is educational content, not financial advice. Trading involves substantial risk. Past performance doesn't guarantee future results.