Peer Rotation Intelligence: Systematic Sector Rotation Indicator Strategy
Master sector rotation trading with our peer rotation strategy. Learn how to use relative strength crypto trading indicators for systematic capital rotation.
Profabighi Capital Research Team
January 29, 2026
Trading Risk Warning
Trading Risk Warning: Trading involves substantial risk of loss and is not suitable for all investors. Past performance does not guarantee future results. You should carefully consider your financial situation and consult with financial advisors before making any investment decisions.
Peer rotation intelligence transforms how traders identify sector leaders. Instead of relying on absolute performance metrics that mislead in correlated markets, this framework uses relative strength analysis to reveal which assets genuinely outperform their peers.
The Peer Rotation Intelligence System combines three complementary indicators: Relative Strength Peers for comprehensive peer comparison, Alpha Tracker for genuine outperformance confirmation, and ROC Tracker for momentum validation. Together, they create a systematic approach to capital rotation that captures relative value opportunities absolute metrics miss.
The Problem with Absolute Performance
Traditional analysis focuses on absolute returns. An asset rising 20% appears strong. But what if its peer group rose 30%? That "strong" performer is actually a laggard.
This relative context matters enormously in correlated markets like cryptocurrency. During bull markets, most assets rise together. During bear markets, most fall together. The question isn't whether an asset is up or down—it's whether it's outperforming or underperforming its peers.
Single-metric approaches create additional blind spots:
- Price-only analysis ignores risk-adjusted performance
- RSI on absolute prices stays overbought during strong trends
- Simple momentum doesn't distinguish skill from beta exposure
The Peer Rotation Intelligence System addresses these limitations through layered confirmation.
Layer 1: Relative Strength Peers Matrix
The foundation of peer rotation intelligence is the Relative Strength Peers indicator. Rather than applying RSI to absolute prices, it calculates RSI on price ratios between assets.
How It Works:
For each pair of assets in your peer group, the indicator calculates:
- Price Ratio = Asset A Price / Asset B Price
- RSI(Price Ratio) = Momentum of relative performance
When RSI of the ratio exceeds 50, Asset A is outperforming Asset B. When below 50, Asset A is underperforming.
Scoring System:
Each asset receives a score based on how many peers it outperforms:
- Win = RSI of ratio > 50 (outperforming that peer)
- Loss = RSI of ratio < 50 (underperforming that peer)
- Total Score = Sum of wins across all peer comparisons
Assets are then ranked by total score. The highest-scoring asset is the strongest relative performer in the group.
Key Features:
- Supports up to 40 simultaneous asset comparisons
- Dual smoothing layers including adaptive VIDYA for noise reduction
- Visual matrix with emoji-coded comparisons for quick scanning
- Dynamic rankings updated in real-time
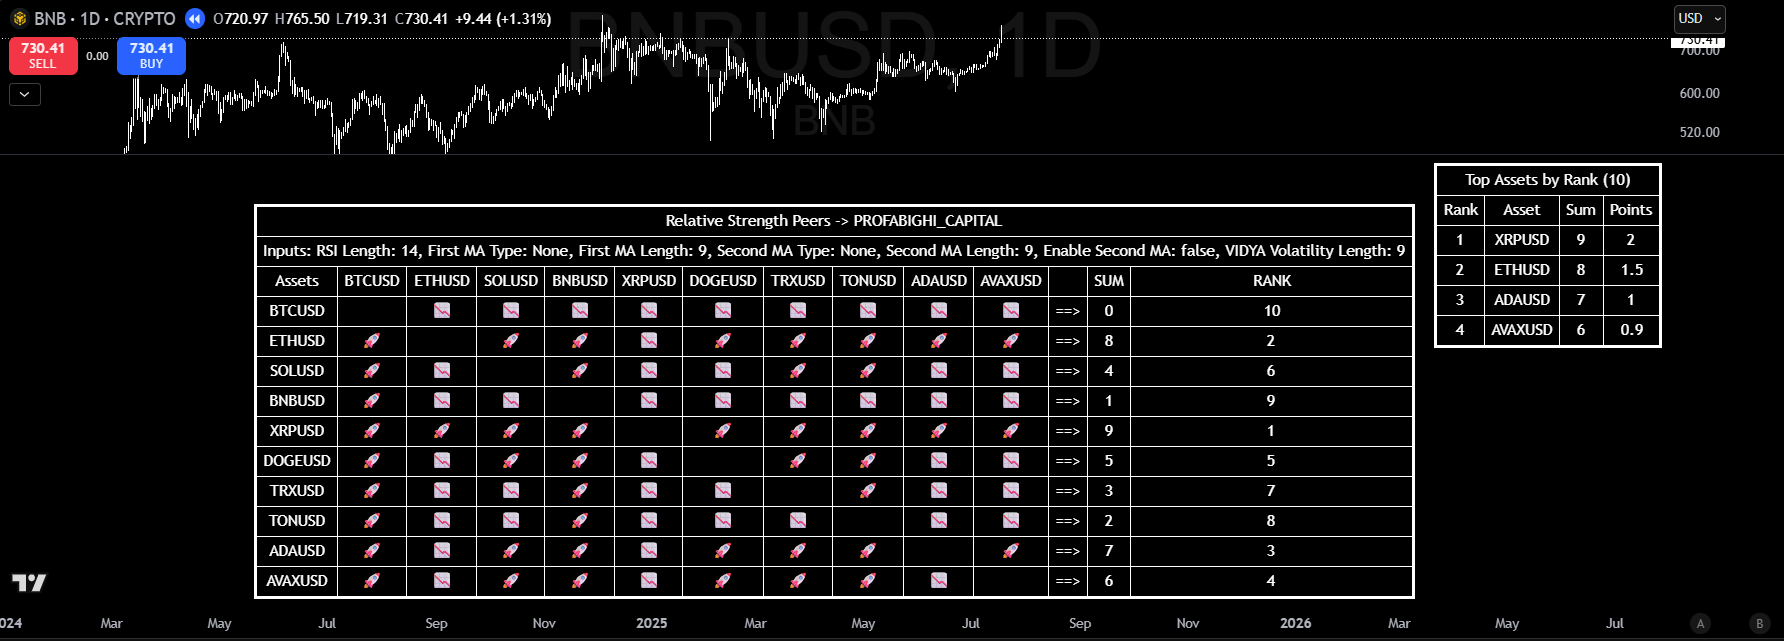
Screenshot captured mid-2025 for illustrative purposes only. The RS Peers indicator displays a 10x10 comparison matrix with pairwise relative strength between assets. Rocket icons indicate outperformance, envelope icons indicate underperformance. The "Top Assets by Rank" table shows XRPUSD ranked #1 (SUM=9), ETHUSD #2 (SUM=8), while BNBUSD ranks #9 (SUM=1) despite positive absolute returns—demonstrating how relative strength exposes hidden laggards.
Layer 2: Alpha Tracker Confirmation
High relative strength doesn't guarantee genuine outperformance. An asset might rank highly simply because it has higher beta—it amplifies market movements in both directions.
The Alpha Tracker separates genuine skill from beta exposure using CAPM-based calculations.
Alpha Calculation:
Alpha = Asset Return - (Beta × Benchmark Return)Where:
- Asset Return = Rolling return over measurement period
- Beta = Covariance(Asset, Benchmark) / Variance(Benchmark)
- Benchmark Return = Market index return (e.g., total crypto market cap)
Interpretation:
- Positive Alpha: Asset generates excess returns beyond what beta exposure explains
- Negative Alpha: Asset underperforms despite market correlation
- Alpha Persistence: Consistency of positive alpha over time
Why This Matters:
An asset with high relative strength but negative alpha is riding market correlation, not generating genuine outperformance. When market conditions shift, these assets often underperform dramatically.
The Alpha Tracker filters these false leaders by requiring positive alpha confirmation before rotation.
Key Features:
- Beta-normalized alpha across multiple assets
- Dynamic gradient coloring for intuitive visualization
- Median-relative indicators for peer context
- Supports up to 33 symbols with modular inputs
![]()
The Alpha Tracker displays alpha values across multiple assets with color gradient visualization: bright green = positive alpha, yellow = near-zero, red = negative. BCHUSD leads with alpha = 0.623, followed by XMRUSD (0.447), UNIUSD (0.416). The Alpha Median of -0.189 indicates market-wide underperformance.
Layer 3: ROC Tracker Validation
The final layer validates that relative strength and alpha are sustainable rather than mean-reverting.
Rate of Change (ROC) measures momentum—the speed and direction of price movement. The ROC Tracker applies this across your peer group, revealing which assets have accelerating versus decelerating momentum.
ROC Calculation:
ROC = ((Current Price - Price N periods ago) / Price N periods ago) × 100Peer-Relative ROC:
The indicator calculates ROC for each asset and compares it to the peer group median:
- ROC Differential = Asset ROC - Peer Median ROC
- Positive Differential: Asset momentum exceeds peer average
- Negative Differential: Asset momentum lags peer average
Why This Matters:
An asset might have strong relative strength and positive alpha, but if its ROC differential is turning negative, the outperformance may be ending. ROC validation ensures you rotate into assets with sustainable momentum, not those approaching mean reversion.
Key Features:
- Uniform-period ROC across all assets
- Peer-relative rankings with gradient visualization
- Median comparisons for group context
- Alert system for momentum shifts
![]()
The ROC Tracker ranks assets by Rate of Change momentum. UNIUSD leads with ROC = +20.257%, followed by BCHUSD (+11.391%), XMRUSD (+9.787%). The ROC Median of -3.879% indicates broad market momentum weakness. BCHUSD maintains top-2 ranking in both ROC Tracker and Alpha Tracker, demonstrating cross-indicator consistency.
The Three-Layer Confirmation Process
The Peer Rotation Intelligence System requires all three layers to align before rotation:
Step 1: Relative Strength Screening
- Identify assets in top 50% of peer rankings
- Focus on assets with rising rank trajectory
- Note assets dropping in rankings (rotation exit candidates)
Step 2: Alpha Confirmation
- Filter top RS assets by positive alpha
- Check alpha persistence (consistency over time)
- Verify alpha momentum (improving vs. deteriorating)
Step 3: ROC Validation
- Confirm positive ROC differential vs. peer median
- Check ROC persistence (sustained outperformance)
- Validate momentum sustainability
Rotation Decision:
- All three layers positive → Rotate into asset
- Any layer negative → Wait or exit existing position
- Conflicting signals → Reduce position size
Composite Scoring Framework
For systematic rotation, combine all three metrics into a composite score based on ranks. Remember: lower ranks = better performance (rank 1 is the best).
Scoring Formula:
Composite Rank = (RS_Rank × 0.35) + (Alpha_Rank × 0.35) + (ROC_Rank × 0.30)Where each rank is the asset's position in its respective metric (1 = best performer).
Score Interpretation:
- Rank 1-3: Top tier leader, maximum allocation
- Rank 4-6: Strong performer, standard allocation
- Rank 7-10: Average performer, minimal allocation
- Rank > 10: Laggard, no allocation / exit
Key Principle: Lower composite rank = stronger rotation candidate.
Position Sizing:
Weight positions inversely by composite rank:
Asset Weight = (1 / Composite_Rank) / Sum(1 / All_Ranks) × Target AllocationThis ensures lower-ranked (better performing) assets receive proportionally larger allocations.
Avoiding the Value Trap
One of the most powerful applications of peer rotation intelligence is avoiding value traps—assets that appear "cheap" on absolute metrics but continue underperforming.
The Value Trap Pattern:
An asset drops 40% from highs. Traditional analysis suggests:
- RSI shows "oversold"
- Price is "cheap" relative to recent highs
- Conclusion: "Buy the dip"
Peer Rotation Reality:
The same asset analyzed through peer rotation:
- RS Rank: Bottom 30% of peer group
- Alpha: Negative (underperforming despite market correlation)
- ROC Differential: Negative (momentum lagging peers)
- Conclusion: "Laggard, avoid"
Key Insight:
Absolute metrics measure where an asset has been. Relative metrics reveal where it's going compared to alternatives. An "oversold" asset that continues underperforming its peers is not a value opportunity—it's a value trap.
Implementation Workflow
Weekly Review Process:
- Update RS Matrix: Refresh peer rankings across your asset universe
- Check Alpha Values: Identify assets with positive, persistent alpha
- Validate ROC: Confirm momentum sustainability
- Calculate Composite Scores: Rank all assets by combined metrics
- Identify Rotation Candidates: Assets entering/exiting top quartile
- Execute Rotations: Sell laggards, buy leaders
Trigger-Based Interim Rotations:
Between weekly reviews, rotate immediately when:
- Asset drops 3+ positions in RS ranking
- Alpha turns negative for 2 consecutive periods
- ROC differential turns negative across multiple timeframes
Risk Management Integration
Position Constraints:
- Maximum single position: 40% of portfolio
- Minimum position: 10% of portfolio
- Maximum correlation between holdings: 0.7
Rotation Frequency:
- Monthly minimum rebalancing
- Trigger-based interim rotations as needed
- Avoid over-rotation (transaction costs erode alpha)
Drawdown Protection:
- Exit when composite score drops below 45
- Reduce position when any single layer turns negative
- Maintain cash buffer for rotation opportunities
Key Takeaways
Relative strength reveals true leaders that absolute metrics miss in correlated markets
Alpha confirmation separates skill from beta exposure, filtering false leaders
ROC validation ensures momentum sustainability before committing capital
Three-layer confirmation reduces false signals and improves rotation accuracy
Composite scoring enables systematic allocation based on quantified outperformance
Value trap avoidance protects capital from "cheap" assets that continue underperforming
Frequently Asked Questions
Q: How many assets should I include in my peer group?
A: For meaningful relative strength analysis, include 8-15 assets with similar characteristics (market cap range, sector, correlation profile). Too few assets limit comparison value; too many dilute signal quality.
Q: How often should I rebalance based on peer rotation signals?
A: Monthly rebalancing captures most rotation opportunities while minimizing transaction costs. Add trigger-based interim rotations for significant rank changes (3+ positions) or alpha/ROC reversals.
Q: Can this framework work for assets beyond cryptocurrency?
A: Yes. The principles apply to any correlated asset class—stocks within sectors, ETFs within categories, forex pairs within regions. Adjust peer groups and benchmarks accordingly.
Q: What if all three layers conflict?
A: Conflicting signals suggest uncertainty. Reduce position size or wait for alignment. Never force a rotation when the framework shows mixed signals.
Q: How do I handle assets not in my peer group that show strong absolute performance?
A: Evaluate whether they belong in your peer group based on correlation and characteristics. If they fit, add them. If not, analyze them within their appropriate peer group before considering allocation.
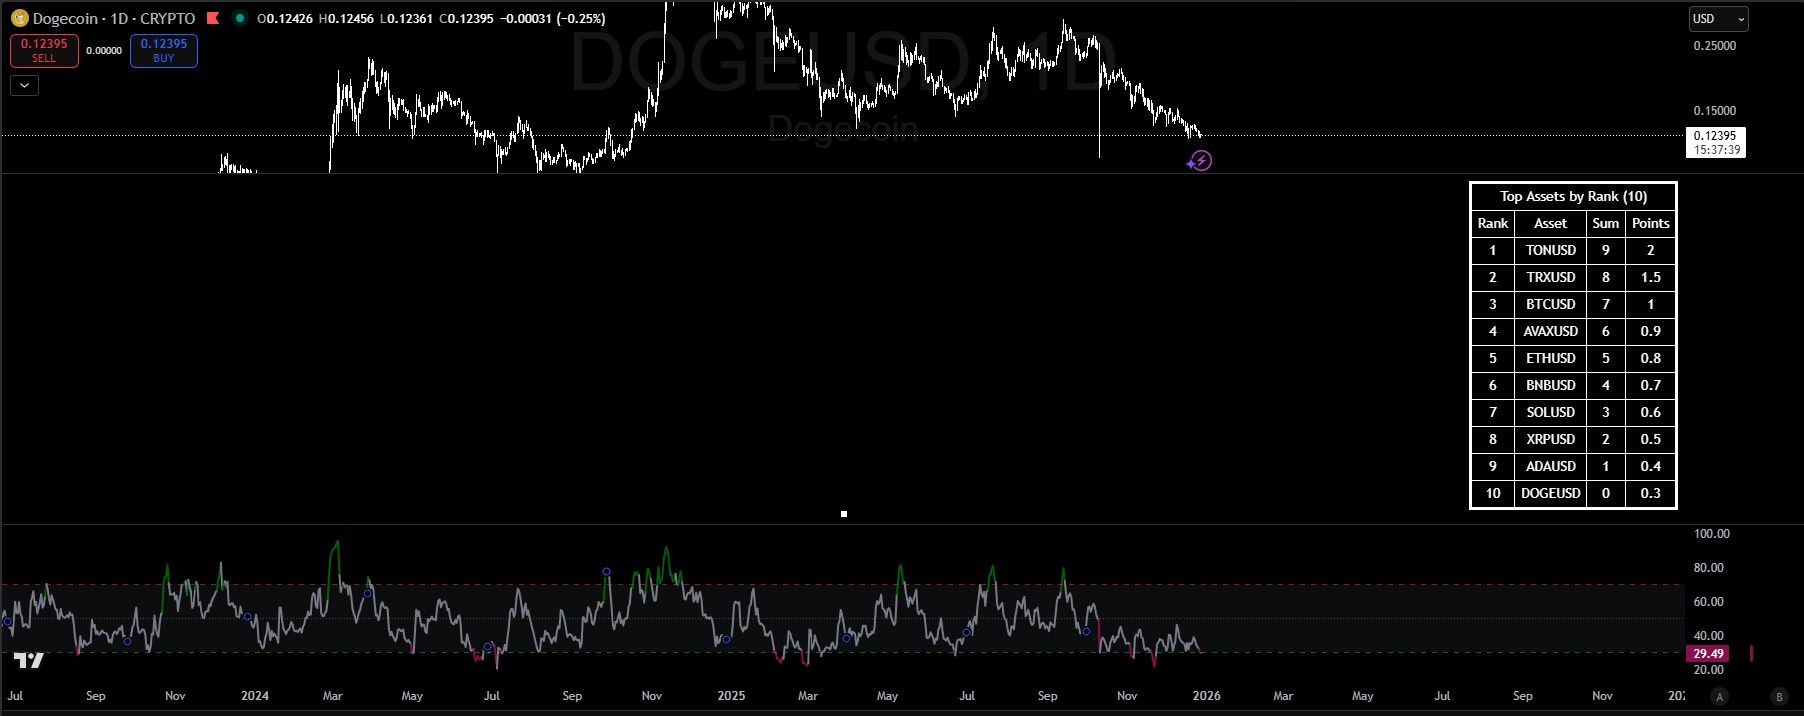
Classic value trap exposed: DOGEUSD shows RSI at 29.49 (technically oversold, below 30 threshold), which traditional analysis would interpret as a buy signal. However, RS Peers ranks DOGEUSD dead last at #10 with SUM=0—the asset lost relative strength comparison against all 9 peers. TONUSD ranks #1 (SUM=9) at the opposite end. This demonstrates why oversold readings in relatively weak assets are value traps, not opportunities.
The Peer Rotation Intelligence System is part of Profabighi Capital's quantitative trading framework. All indicators are available on TradingView.