Portfolio Efficiency Optimizer: Sharpe Ratio + Alpha + Omega Ratio
Complete framework for maximizing risk-adjusted returns using three complementary metrics. Combine Sharpe, Alpha, and Omega as a confirmation system.
Profabighi Capital Research Team
December 23, 2025
Trading Risk Warning
Trading Risk Warning: Trading involves substantial risk of loss and is not suitable for all investors. Past performance does not guarantee future results. You should carefully consider your financial situation and consult with financial advisors before making any investment decisions.
TradingView Scripts
You've built a portfolio of promising crypto assets. Each one looked great in isolation—strong momentum, solid fundamentals, decent returns. But when you check your overall portfolio performance, something doesn't add up. Despite picking "winners," your risk-adjusted returns are mediocre at best.
The problem? You're optimizing for the wrong thing.
Most traders focus on a single metric—usually raw returns or Sharpe Ratio alone. But institutional-quality portfolios require multi-dimensional efficiency optimization. That's where the Portfolio Efficiency Optimizer comes in.

The Portfolio Efficiency Optimizer framework combines three complementary metrics—Sharpe Ratio, Alpha, and Omega Ratio—to provide a complete view of portfolio efficiency across risk-adjusted returns, skill-based performance, and probability distribution.
The Single-Metric Trap
Here's what happens when you optimize for just one metric:
Sharpe-only portfolios chase risk-adjusted returns but ignore whether those returns come from genuine skill or just market exposure. You might have a great Sharpe Ratio simply because you're riding a bull market—not because you're actually good at picking assets.
Return-only portfolios ignore risk entirely. Sure, you made 50% last quarter, but you also experienced a 40% drawdown. Was that worth it?
Alpha-only portfolios focus on excess returns but miss the probability distribution of outcomes. You might have positive alpha on average, but if your wins are small and your losses are catastrophic, you're still losing.
The solution is combining three complementary metrics that each capture a different dimension of portfolio efficiency.
The Three Pillars of Portfolio Efficiency
Pillar 1: Sharpe Ratio — Overall Risk-Adjusted Efficiency
The Sharpe Ratio measures return per unit of total risk. It answers: "How much return am I getting for the volatility I'm taking?"
The Formula:
Sharpe Ratio = (Asset Return - Risk-Free Rate) / Asset VolatilityHow Profabighi Capital's Sharpe Ratio Indicator Works:
The indicator calculates daily returns as the percentage change from the previous close. It then computes a rolling mean return and standard deviation over a configurable period (default: 7 bars). The raw Sharpe is smoothed using an EMA to reduce noise, then annualized using √365 for crypto's 24/7 trading.
Interpretation:
- Sharpe above strong threshold (green): Strong positive risk-adjusted returns (default threshold: 5)
- Sharpe between thresholds (gray): Neutral efficiency zone
- Sharpe below weak threshold (red): Weak risk-adjusted returns
Why It Matters:
Sharpe tells you if you're being compensated for the volatility you're taking. A Sharpe of 2.0 means you're earning 2 units of return for every 1 unit of risk. But Sharpe alone doesn't tell you WHERE those returns come from.
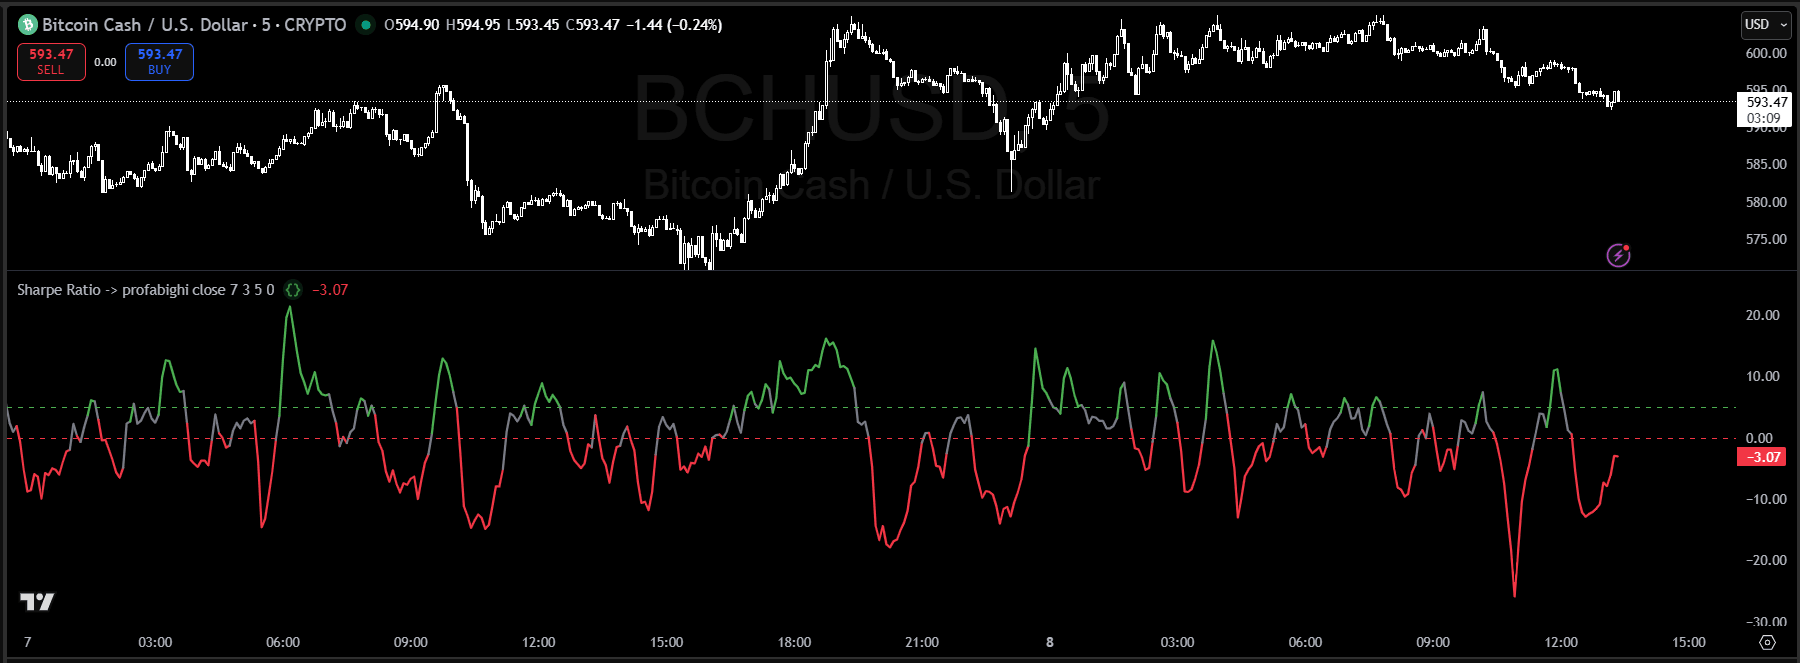
Sharpe Ratio indicator displaying risk-adjusted performance oscillation. The indicator features a dual-line system with dynamic color-coding: green when above the strong threshold, red when below the weak threshold, and gray in the neutral zone. Extreme readings near +/-20 indicate momentum exhaustion points. The zero-line serves as the critical regime-change threshold—crossovers above zero signal bullish bias, crossovers below signal bearish positioning. The indicator measures return per unit of volatility with EMA smoothing for noise reduction.
Pillar 2: Alpha — Skill-Based Excess Returns
Alpha isolates the returns that come from genuine skill versus market exposure. It answers: "Am I actually good at picking assets, or am I just riding the market?"
The Formula:
Alpha = Asset Return - [Risk-Free Rate + Beta × (Market Return - Risk-Free Rate)]How Profabighi Capital's Alpha Indicator Works:
The indicator calculates returns for both your asset and a benchmark (default: BTC). It computes the covariance between asset and benchmark returns, then divides by benchmark variance to get Beta. Alpha is the difference between actual returns and expected returns given that Beta exposure.
Interpretation:
- Alpha > 0 (green): Generating excess returns beyond market exposure
- Alpha < 0 (red): Underperforming what a passive market position would deliver
Why It Matters:
Positive alpha means you're adding value through asset selection. Negative alpha means you'd be better off just holding the benchmark. This is crucial for portfolio construction—you want assets that contribute genuine skill-based returns, not just market exposure you could get cheaper elsewhere.
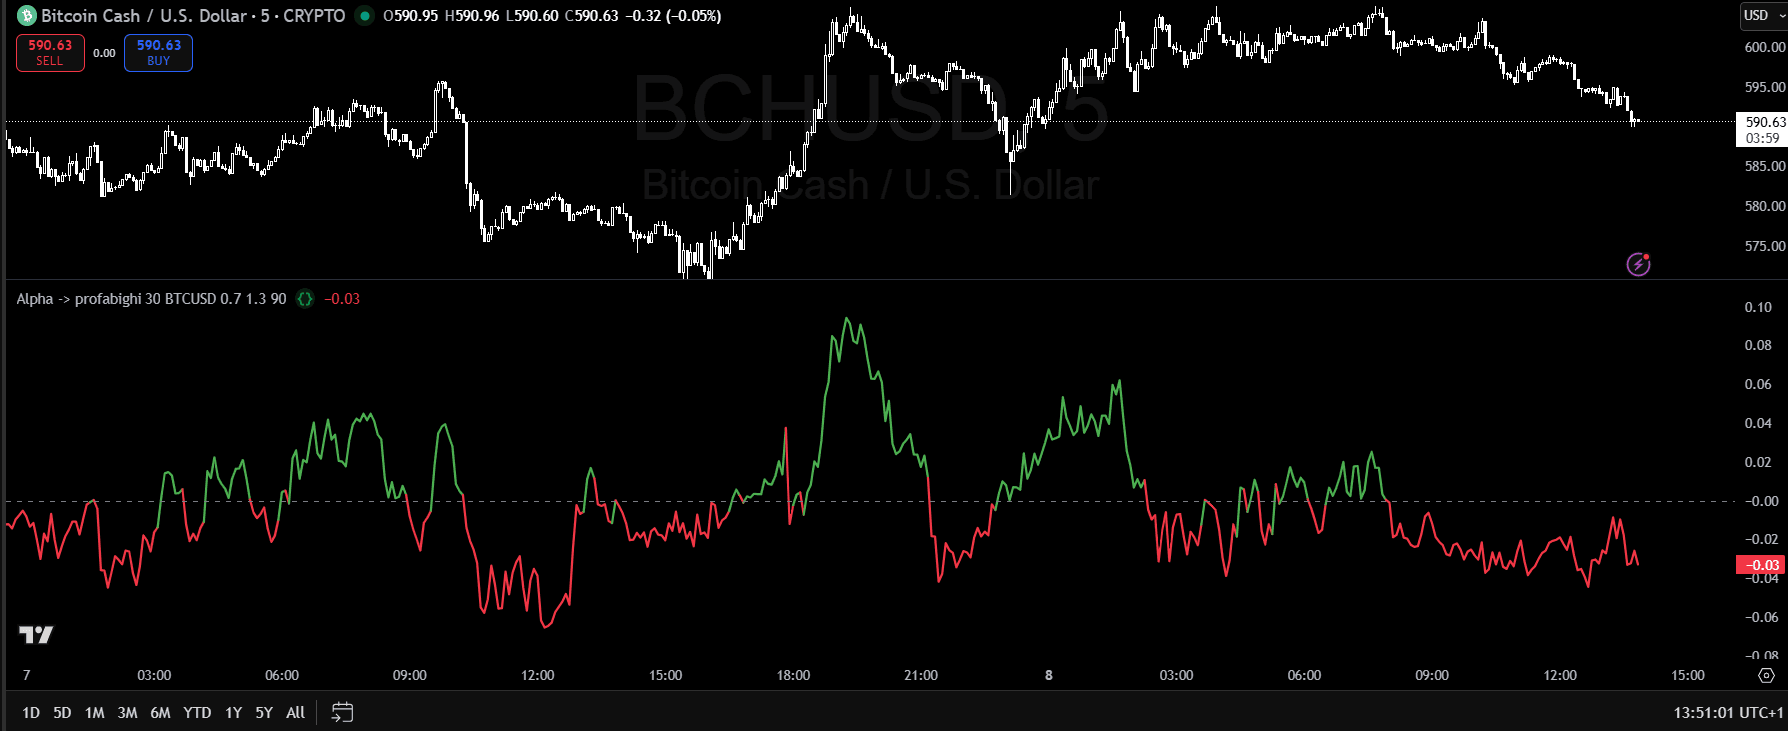
Alpha indicator measuring excess returns relative to a benchmark (BTCUSD). Green coloring indicates positive alpha (outperformance vs benchmark), red indicates negative alpha (underperformance). The indicator peaked at +0.10 during strong outperformance phases and troughed at -0.06 during underperformance. Zero-line crossovers mark shifts between outperformance and underperformance regimes. The 30-period lookback captures medium-term relative performance dynamics, isolating genuine skill-based returns from market beta exposure.
Pillar 3: Omega Ratio — Probability-Weighted Outcomes
The Omega Ratio captures the probability distribution of returns. It answers: "What's the ratio of my gains above a threshold versus my losses below it?"
The Formula:
Omega Ratio = Sum of Returns Above Threshold / Sum of Returns Below ThresholdHow Profabighi Capital's Omega Ratio Indicator Works:
The indicator loops through a configurable period (default: 90 bars) and separates returns into gains above a target threshold and losses below it. The ratio of cumulative gains to cumulative losses gives you Omega. This is smoothed with an EMA to reduce noise.
Interpretation:
- Omega > 1.0 (green): More probability-weighted gains than losses
- Omega between 0.5 and 1.0 (gray): Moderate distribution quality
- Omega < 0.5 (red): Unfavorable probability distribution
Why It Matters:
Omega captures something Sharpe misses: the shape of your return distribution. Two assets can have identical Sharpe Ratios but very different Omega Ratios. The one with higher Omega has a more favorable distribution of outcomes—more frequent wins, smaller losses, or both.
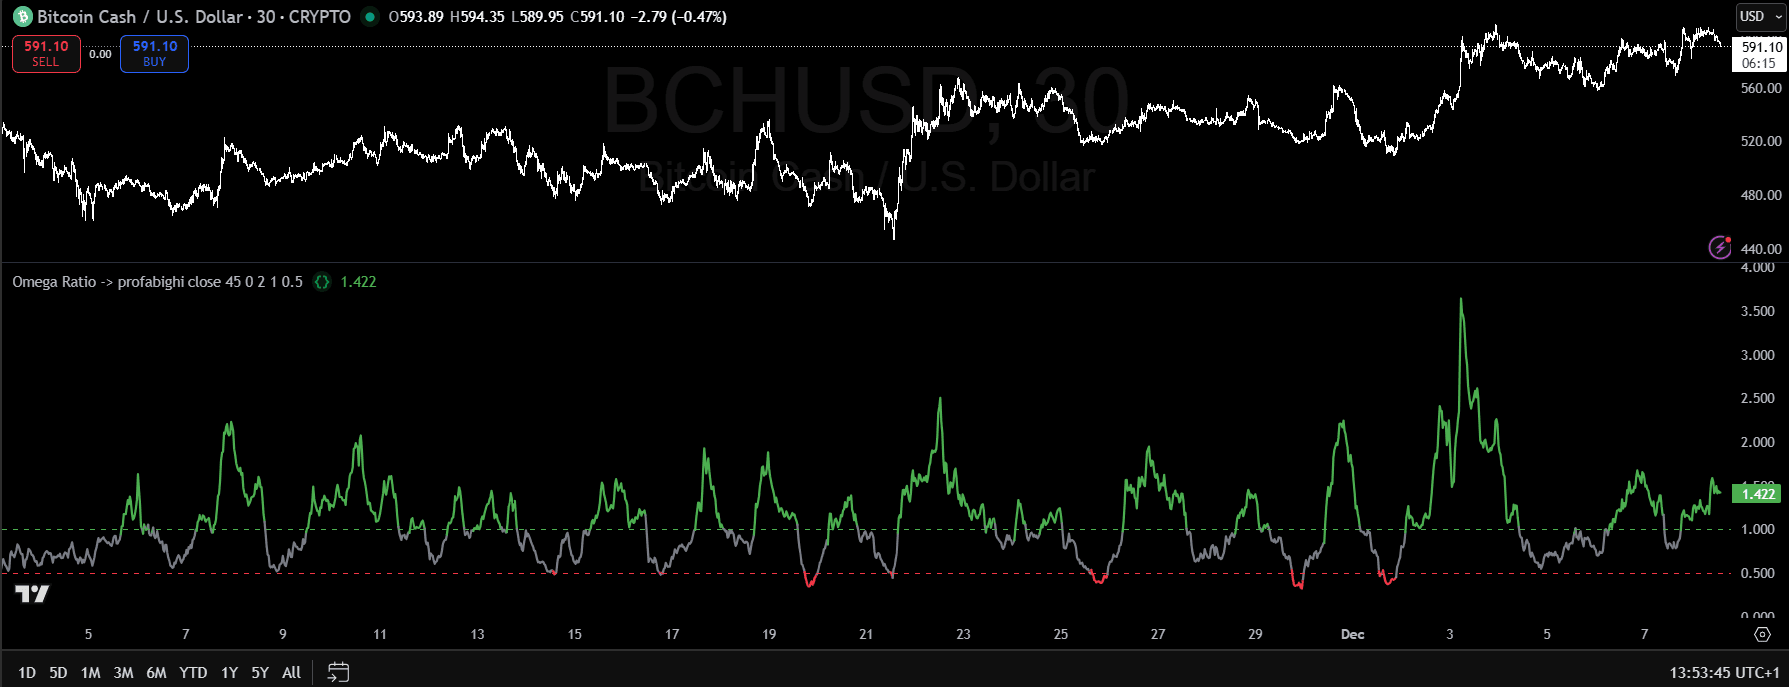
Omega Ratio indicator displaying probability-weighted gains versus losses. Green coloring indicates Omega above 1.0 (favorable risk/reward conditions), gray between 0.5 and 1.0 (moderate distribution quality), and red below 0.5 (unfavorable probability distribution). The indicator spiked to 4.0 during strong momentum phases and dropped below 1.0 during consolidation. The 1.0 threshold serves as the critical regime-change level—readings above indicate more probability-weighted gains than losses. The 45-period lookback captures medium-term distribution characteristics that Sharpe Ratio misses.
Using All Three Indicators Together
The real power comes from using these three indicators as a confirmation system. Each metric captures something the others miss—when all three align, you have high-conviction signals.
The Confirmation Framework
Strong Buy Signal (All Three Aligned Bullish):
- Sharpe above threshold and rising (default threshold: 5)
- Alpha > 0 (outperforming the benchmark)
- Omega above threshold (default threshold: 1.0)
When all three are green and trending up, the asset is showing efficiency across all dimensions. This is your highest-conviction scenario.
Strong Avoid Signal (All Three Aligned Bearish):
- Sharpe below threshold and falling
- Alpha < 0 (underperforming the benchmark)
- Omega below threshold
When all three are red and trending down, the asset is failing across all dimensions. Avoid or reduce exposure.
Mixed Signals (Divergence):
This is where it gets interesting. Divergences between the three metrics often reveal hidden information:
High [Sharpe Ratio](/content/TradingView/Indicators/Sharpe/sharpe-ratio) + Negative [Alpha](/content/TradingView/Indicators/Alpha/alpha): You're getting good risk-adjusted returns, but it's just market exposure—not skill. You'd be better off holding the benchmark directly.
Positive [Alpha](/content/TradingView/Indicators/Alpha/alpha) + Low [Omega Ratio](/content/TradingView/Indicators/Omega/omega-ratio): You're outperforming the benchmark on average, but your wins are small and your losses are large. The distribution is unfavorable despite the positive alpha.
High [Omega Ratio](/content/TradingView/Indicators/Omega/omega-ratio) + Low [Sharpe Ratio](/content/TradingView/Indicators/Sharpe/sharpe-ratio): Your win/loss distribution is favorable, but you're not being compensated for the volatility. The risk-adjusted efficiency is poor.
Practical Application
Step 1: Set Up Your Dashboard
Add all three indicators to your TradingView chart. Stack them vertically so you can see the alignment at a glance.
Step 2: Check for Alignment
Before entering any position, verify that at least 2 out of 3 indicators are showing favorable conditions. Ideally, wait for all three.
Step 3: Monitor for Divergence
Once in a position, watch for divergences. If one indicator starts deteriorating while others hold, it's an early warning sign. If two or more turn negative, consider reducing exposure.
Step 4: Use Timeframe Context
These indicators behave differently across timeframes. What looks great on the daily might look terrible on the weekly. Always check multiple timeframes before making decisions.
Common Mistakes to Avoid
1. Creating Arbitrary Scores
The actual values of Sharpe, Alpha, and Omega vary wildly depending on the asset, timeframe, and market conditions. There's no universal "good" threshold—context matters. Don't try to normalize these into a single score.
2. Over-Optimizing
Looking for the "perfect" combination of all three metrics being at extreme positive values is a recipe for missing opportunities. Use them as a confirmation system, not a filter for perfection.
3. Ignoring Direction
A rising Sharpe of 0.5 is often better than a falling Sharpe of 2.0. Direction matters as much as absolute values.
4. Single Timeframe Analysis
These indicators behave differently across timeframes. Always check multiple timeframes before making decisions.
5. Ignoring Divergences
When indicators disagree, that's information—not noise. Dig deeper to understand why.
Putting It All Together
The Portfolio Efficiency Optimizer isn't about finding the "best" single metric—it's about using complementary metrics that each capture a different dimension of quality.
[Sharpe Ratio](/content/TradingView/Indicators/Sharpe/sharpe-ratio) tells you if you're being compensated for risk.
[Alpha](/content/TradingView/Indicators/Alpha/alpha) tells you if you're adding genuine skill.
[Omega Ratio](/content/TradingView/Indicators/Omega/omega-ratio) tells you if your probability distribution is favorable.
Together, they create a multi-dimensional view of portfolio efficiency that single-metric approaches miss. When all three align, you have conviction. When they diverge, you have information.
Key Principles
- Confirmation beats single-metric: Wait for alignment across multiple indicators
- Divergences are information: When indicators disagree, dig deeper
- Context matters: Values vary by asset, timeframe, and market regime
- Direction matters: Rising mediocre values often beat falling great values
- Simplicity wins: Use these as a confirmation system, not a complex scoring formula
Implementation Checklist
Indicators Required (TradingView):
Setup:
- Add all three indicators to your chart
- Stack them vertically for easy visual comparison
- Use default settings as starting point, adjust based on your timeframe
Daily Workflow:
- Check alignment across all three indicators
- Look for divergences that reveal hidden information
- Verify signals across multiple timeframes
- Act on high-conviction signals (2+ indicators aligned)
- Monitor positions for deteriorating conditions
Next Steps
- Set up the three indicators on TradingView (Sharpe Ratio, Alpha, Omega Ratio)
- Stack them vertically for easy visual alignment checking
- Practice reading divergences on historical data before trading live
- Check multiple timeframes to understand how the indicators behave differently
- Start with confirmation — only act when at least 2 out of 3 indicators align
The Portfolio Efficiency Optimizer is about using multiple lenses to see the same asset. Each lens reveals something different. Together, they give you a complete picture that single-metric approaches miss.
Indicators Used:
- Sharpe Ratio (Risk-adjusted efficiency measurement with EMA smoothing and annualization)
- Alpha (Skill-based excess returns isolation vs benchmark)
- Omega Ratio (Probability-weighted return distribution analysis)
All available on TradingView.
Note on Thresholds: The default thresholds mentioned (Sharpe: 5, Omega: 1.0) are starting points only. Optimal thresholds vary significantly depending on the asset, timeframe, and market conditions. What works for BTC on the daily chart may not work for altcoins on the 4H chart. Always backtest and adjust thresholds based on your specific trading context.