Relative Performance Matrix: Systematic Peer-Relative Alpha Generation
Learn how to identify genuine crypto outperformers using the Relative Performance Matrix—combining Alpha Tracker, Relative Strength Peers, and ROC Tracker for systematic sector rotation.
Profabighi Capital Research Team
January 9, 2026
Trading Risk Warning
Trading Risk Warning: Trading involves substantial risk of loss and is not suitable for all investors. Past performance does not guarantee future results. You should carefully consider your financial situation and consult with financial advisors before making any investment decisions.

An asset rising 50% sounds impressive—until you realize its peer group rose 60%. That's not outperformance. That's underperformance disguised as gains.
The Relative Performance Matrix solves this fundamental problem by combining three complementary indicators to systematically identify which assets are genuinely outperforming their peer group with sustainable momentum.
The Problem with Absolute Returns
Most traders celebrate absolute returns without considering peer-relative context. This matters because:
- Opportunity cost is real: Capital in underperformers could have been in leaders
- Relative weakness precedes absolute weakness: Assets losing relative strength often decline absolutely later
- Sector rotation requires peer comparison: You can't rotate into strength without knowing what "strength" means relative to alternatives
The institutional approach has always been peer-relative. Now you can apply the same framework.
The Three Pillars
1. Alpha Tracker — Measuring Skill-Based Returns
Alpha represents returns attributable to asset-specific factors rather than market exposure. The Alpha Tracker calculates Jensen's Alpha for up to 33 assets simultaneously.
Formula:
Alpha = Asset_Mean_Return - (Beta × Benchmark_Mean_Return)Key Features:
- Tracks 33 assets in sortable table format
- Color gradient: red (negative alpha) to green (positive alpha)
- Configurable lookback period (default 30 days)
- Optional Beta Regime Context (L/M/H labels)
- RAM and APS metrics for advanced analysis
Target: Positive alpha (green) and among highest values in peer group
![]()
The Alpha Tracker displays alpha scores for 30+ assets with color-coded cells. Green indicates positive alpha (outperformance vs benchmark), red indicates negative alpha. The left panel shows top alpha generators, while the right panel displays the median alpha. Includes RAM (Regime Alpha Multiplier) and APS (Alpha Persistence Score) columns for advanced analysis.
2. Relative Strength Peers — Identifying Leadership
RSP compares each asset's momentum against all peers using RSI-based scoring.
How It Works:
- Calculate price ratio for each asset pair
- Apply RSI to that ratio (default length 14)
- Optional MA smoothing (9 types available)
- Score: 1 if RSI > 50, else 0
Key Features:
- Compares up to 40 assets simultaneously
- Flexible RSI smoothing options
- Gradient or top-N highlighting
- Score = peer outperformance count
Target: Score > 80% of maximum possible
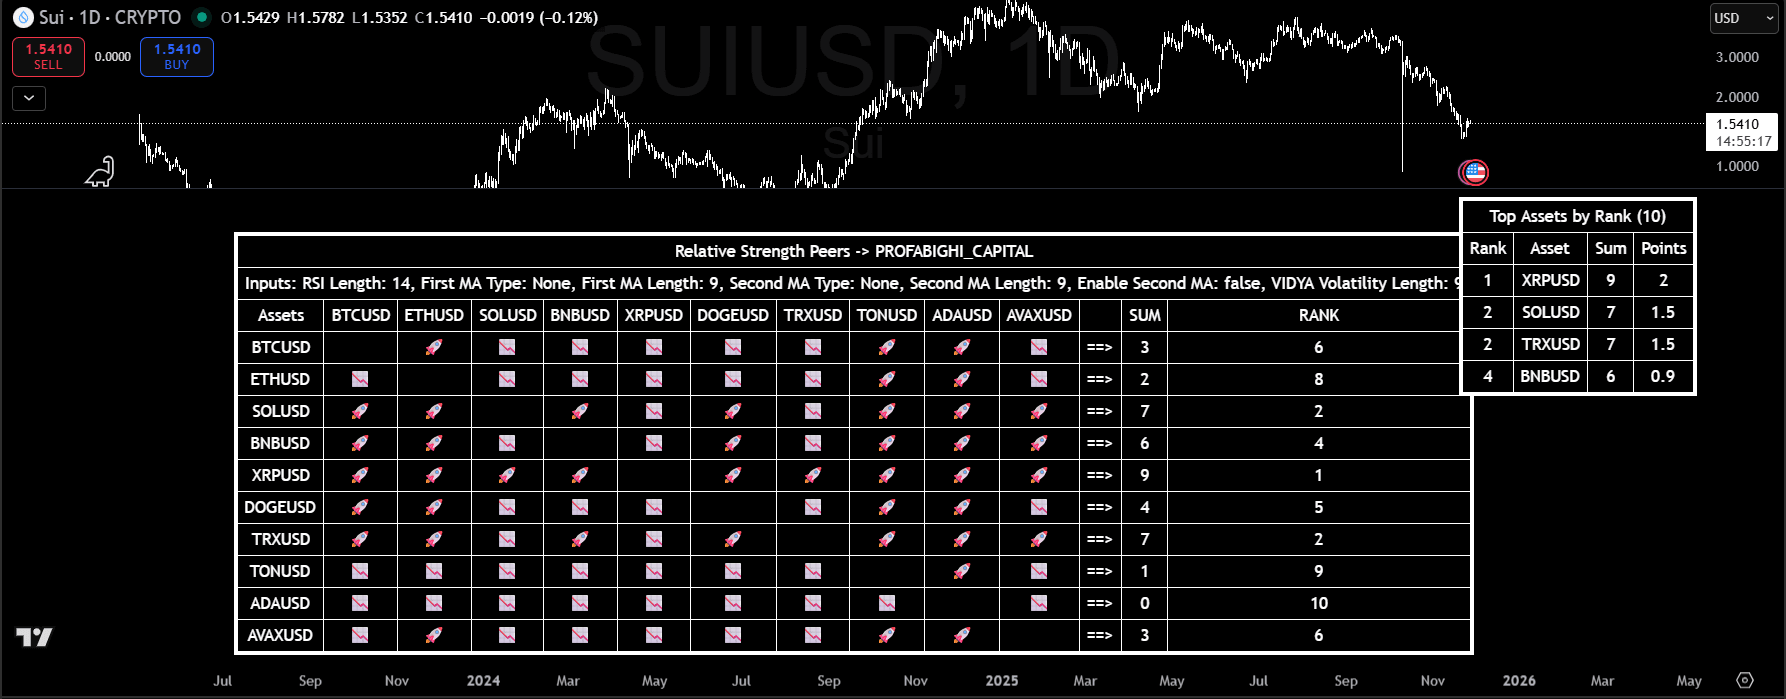
The RSP matrix compares each asset against all peers using RSI-based scoring. Assets with 🚀 emoji are outperforming peers, assets without are underperforming. The "Top Assets by Rank" panel shows consolidated scores—higher scores mean the asset is beating more peers.
3. ROC Tracker — Confirming Momentum
ROC Tracker measures Rate of Change across multiple assets for momentum confirmation.
Formula:
ROC = ((Current_Price - Price_N_Periods_Ago) / Price_N_Periods_Ago) × 100Key Features:
- Tracks 33 assets with configurable period
- Median ROC calculation for peer comparison
- Emoji indicators (🚀 above median, 📉 below)
- Sorted top performers table
Target: ROC > peer median + 5% differential
![]()
The ROC Tracker displays momentum readings for 30+ assets with color-coded cells. Green indicates positive ROC, red indicates negative. The left panel shows top momentum performers with 🚀 emoji, while the right panel shows the median ROC for peer comparison.
The Synergy: Three-Dimensional Analysis
Each indicator alone provides incomplete information. Together, they create a complete picture:
| Alpha | RSP | ROC | Signal |
|---|---|---|---|
| Positive (green) | High score | Above median | Strong buy |
| Positive | Declining | Positive | Caution—alpha fading |
| Negative (red) | Low score | Negative | Avoid |
| Negative | Rising | Positive | Watch—potential turnaround |
Key insight: Sustainable relative outperformance requires all three dimensions to align.
Implementation Rules
Entry Conditions (ALL required)
- Alpha is positive (green in table) and among highest in peer group
- RSP Score is high (asset outperforming most peers)
- ROC > Peer Median (🚀 emoji in ROC Tracker)
- No bearish divergence
Exit Conditions (ANY triggers exit)
- Alpha turns negative (red in table)
- RSP Score drops significantly (losing to more peers)
- ROC < Peer Median for 3+ periods (📉 emoji)
- Bearish divergence appears
- Better opportunity identified in peer group
Limitations
What This Framework Does Well:
- Identifies genuine outperformers
- Provides systematic signals
- Captures rotation opportunities
What It Doesn't Do:
- Predict market direction
- Work when correlations spike to 1.0
- Account for transaction costs
- Guarantee absolute returns
When NOT to Use:
- Market-wide capitulation
- Illiquid assets
- If you can't monitor weekly
Key Takeaways
- Absolute returns lie; relative performance tells truth
- Three dimensions beat one—Alpha + RSP + ROC together
- Peer group definition matters—5-20 similar assets
- Exit rules are as important as entry rules
Disclaimer: Educational content only. Trading cryptocurrencies involves substantial risk. Past performance does not guarantee future results. Always conduct your own research.