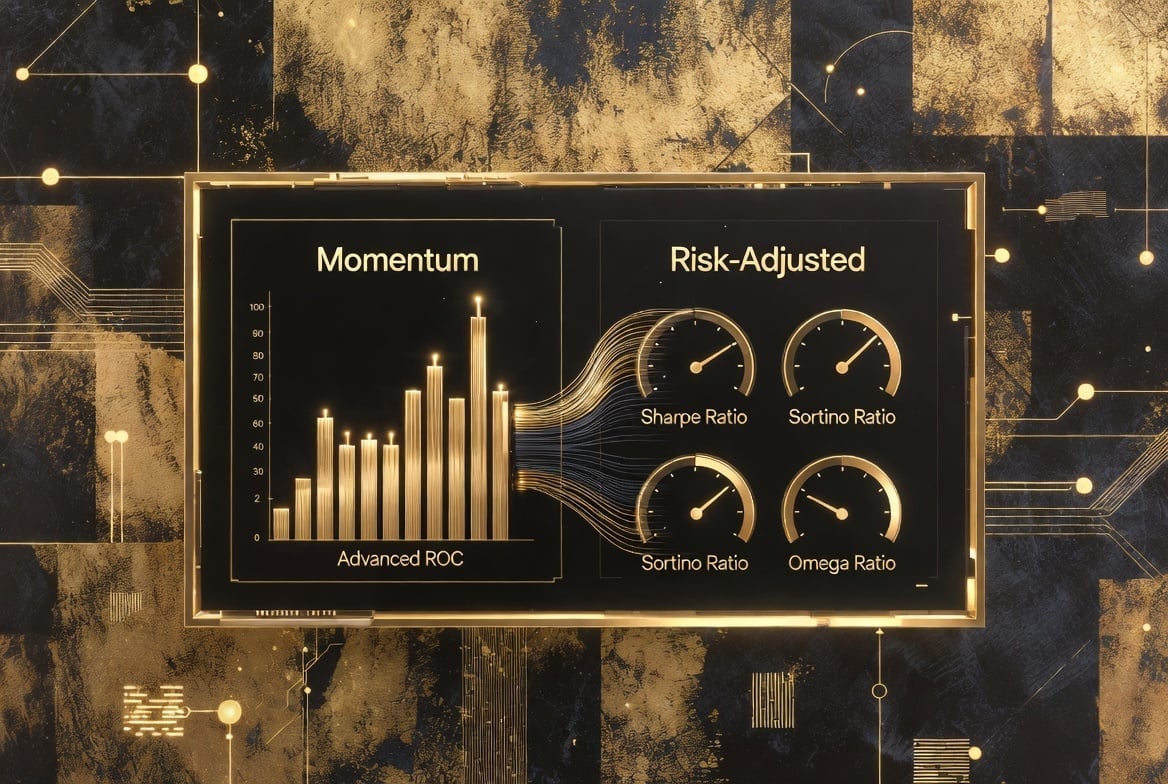
Risk-Adjusted Momentum Framework: Advanced ROC + Sharpe/Sortino/Omega Ratios
Complete framework for combining momentum analysis (Advanced ROC Suite) with risk-adjusted performance metrics (Sharpe, Sortino, Omega) for systematic crypto trading. Learn multi-period momentum analysis, divergence detection, and integrated position sizing.
Profabighi Capital Research Team
January 4, 2026
Trading Risk Warning
Trading Risk Warning: Trading involves substantial risk of loss and is not suitable for all investors. Past performance does not guarantee future results. You should carefully consider your financial situation and consult with financial advisors before making any investment decisions.
A trader spots Bitcoin breaking out. Momentum looks strong. ROC is positive. They go all-in.
Two weeks later, they're down 15%. What happened?
The momentum was real. But they ignored the risk-adjusted context. High momentum with terrible downside protection is a trap. High momentum with strong Sharpe and Sortino ratios? That's a trade worth taking.
This is the problem with momentum-only trading. Raw momentum tells you WHAT is moving. It doesn't tell you if that movement is worth the risk you're taking.
The Risk-Adjusted Momentum Framework solves this by combining three complementary dimensions:
- Advanced ROC Suite - Multi-period momentum analysis with divergence detection
- Risk-Adjusted Ratios - Sharpe, Sortino, and Omega for comprehensive risk assessment
- Integrated Decision Matrix - How to combine all signals for high-probability trades
Together, these components answer the only question that matters: "Is this momentum move worth the risk?"
The Momentum-Only Trading Problem
Most traders use momentum indicators in isolation. They see ROC crossing above zero and buy. They see strong upward momentum and increase position size.
But momentum alone is incomplete. It measures velocity without measuring quality.
The Critical Questions Momentum Can't Answer:
- Is this momentum sustainable or about to reverse?
- Are gains larger than losses during this momentum phase?
- Is the risk-adjusted return worth the volatility?
- Does downside risk justify the potential upside?
Example Pattern:
Asset shows +15% ROC over 14 days (strong momentum). Trader enters long position.
But hidden context reveals:
- Sortino Ratio = 0.3 (terrible downside protection)
- Omega Ratio = 0.8 (losses exceed gains)
- Sharpe Ratio = 0.5 (poor risk-adjusted returns)
The momentum was real, but the risk-adjusted quality was terrible. When momentum reversed, losses amplified because downside protection was weak.
The Solution:
Combine momentum analysis with risk-adjusted performance metrics. Only trade momentum when risk-adjusted quality confirms the move is worth taking.
Component 1: Advanced ROC Suite — Multi-Dimensional Momentum Analysis
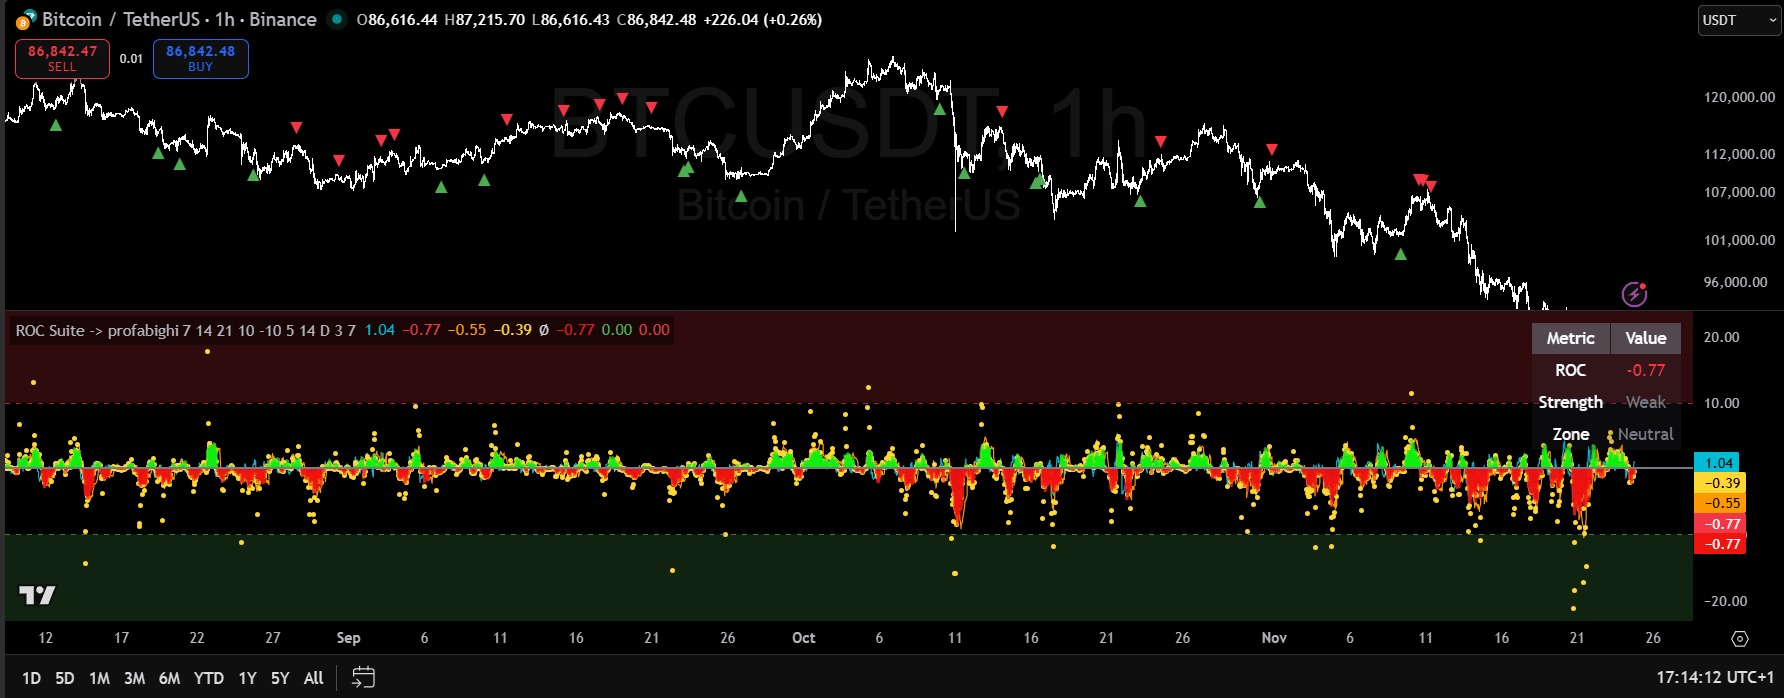
The Advanced ROC Suite displays multi-timeframe momentum through color-coded histogram layers and discrete triangle signals. Green histogram layers indicate strong positive momentum, yellow/orange show moderate momentum, and red layers signal weak or negative momentum. Green upward triangles appear when the indicator detects bullish momentum reversals at oversold levels, while red downward triangles mark bearish momentum exhaustion at overbought zones. Yellow dots highlight momentum regime transitions. The indicator calculates ROC across three periods simultaneously—Fast (7), Medium (14), and Slow (21)—to capture short-term shifts, intermediate trends, and longer-term momentum. When all three ROC periods align in the same direction (triple alignment), this signals highest-conviction multi-timeframe confirmation. The histogram color progression provides continuous momentum context: transitions from green to yellow to orange to red indicate deteriorating momentum, while the reverse indicates strengthening momentum. Use green triangles at support with green histograms for long entries, and red triangles at resistance with red/orange histograms for exits or shorts.
Traditional ROC (Rate of Change) measures price velocity over a single period. The Advanced ROC Suite extends this by analyzing momentum across multiple timeframes simultaneously, detecting divergences, and classifying trend strength.
What Advanced ROC Measures
Core ROC Calculations:
ROC = ((Current Price - Price N periods ago) / Price N periods ago) × 100The indicator calculates three ROC periods simultaneously:
- Fast ROC (7 periods): Captures short-term momentum shifts
- Medium ROC (14 periods): Primary momentum gauge
- Slow ROC (21 periods): Longer-term trend confirmation
Volume-Weighted Momentum:
Volume Weight = Current Volume / Average Volume (14 periods)
ROC Volume-Weighted = Medium ROC × Volume Weight
This filters out low-volume noise and emphasizes high-conviction moves. When volume is 2x average, momentum signals carry 2x weight.
Divergence Detection
The indicator automatically detects price/momentum divergences at pivot points:
Bullish Divergence:
- Price makes lower low
- ROC makes higher low
- Signal: Momentum weakening on downside → Potential reversal up
Bearish Divergence:
- Price makes higher high
- ROC makes lower high
- Signal: Momentum weakening on upside → Potential reversal down
Divergences at pivot points (local highs/lows) provide early warning of trend exhaustion before price actually reverses.
Trend Strength Classification
The indicator categorizes momentum into three regimes:
- Strong Trend: |ROC| > 7% → High-conviction directional move
- Moderate Trend: 3% < |ROC| < 7% → Standard momentum
- Weak Trend: |ROC| < 3% → Low momentum, reduce position sizes
This classification helps you size positions appropriately. Strong trends justify larger positions. Weak trends require minimal exposure.
Triple ROC Alignment
When all three ROC periods align in the same direction (all positive or all negative), you have multi-timeframe momentum confirmation. This is your highest-conviction signal.
Alignment Patterns:
- All Positive (Fast > 0, Medium > 0, Slow > 0): Multi-timeframe bullish momentum → Increase long exposure
- All Negative (Fast < 0, Medium < 0, Slow < 0): Multi-timeframe bearish momentum → Reduce longs or short
- Mixed: Conflicting timeframes → Reduce position sizes, wait for alignment
Component 2: Risk-Adjusted Ratios — The Quality Filter
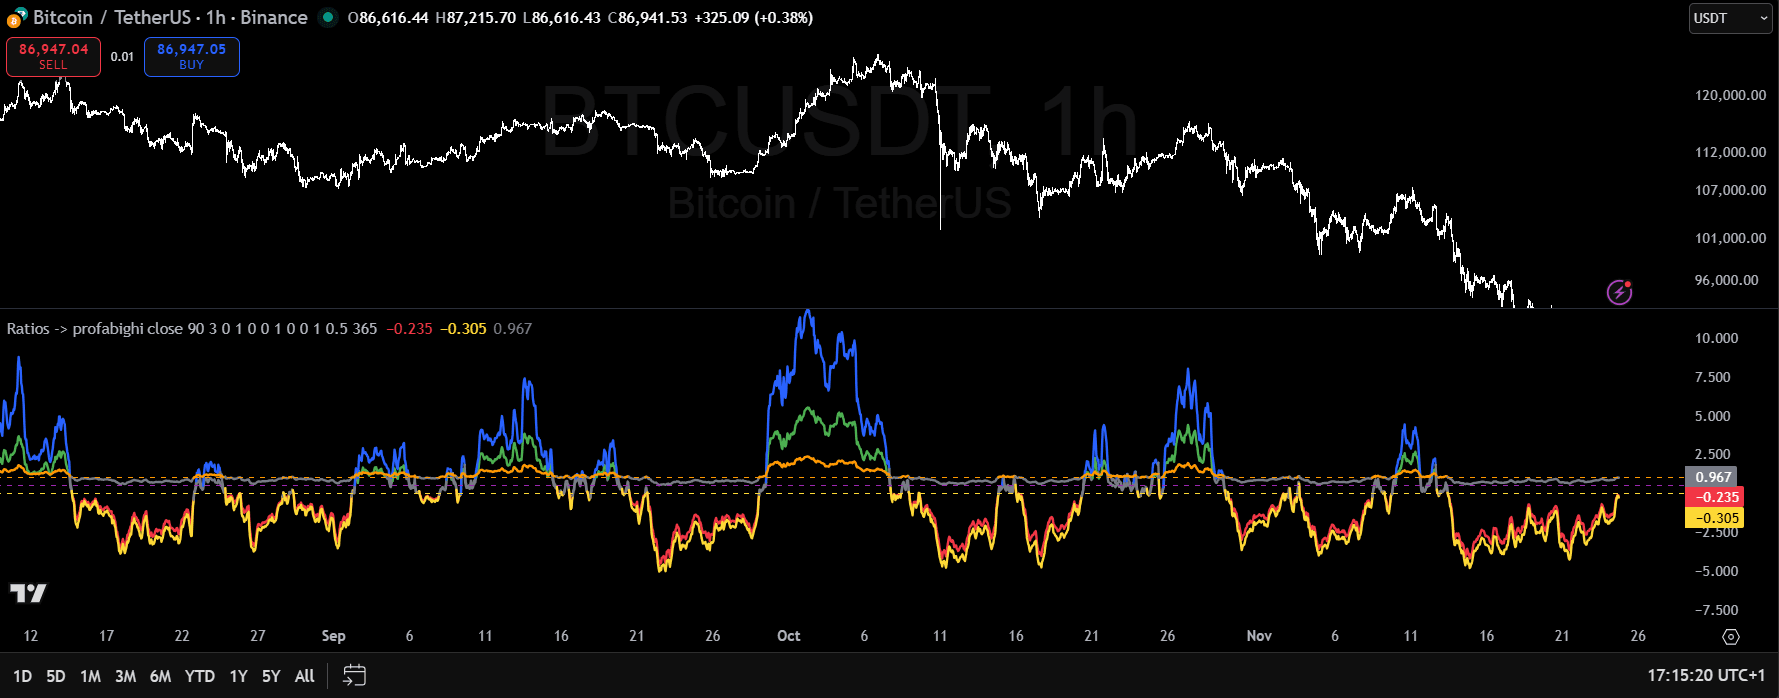
The RATIOS indicator plots three risk-adjusted performance metrics simultaneously: Sharpe Ratio (green when >1.0, red when <0.0, gray between), Sortino Ratio (blue when >1.0, yellow when <0.0, gray between), and Omega Ratio (orange when >1.0, purple when <0.5, gray between). Each line is smoothed with a 3-period EMA to reduce noise. Sharpe Ratio measures excess return per unit of total volatility—values above 1.0 indicate good risk-adjusted returns. Sortino Ratio measures excess return per unit of downside volatility only, ignoring upside volatility—values above 1.0 indicate good downside protection. Omega Ratio measures probability-weighted gains versus losses—values above 1.0 mean gains exceed losses (positive expectancy), while values below 1.0 mean losses exceed gains (negative expectancy). The indicator calculates these ratios over a 90-period lookback window. Horizontal threshold lines mark the strong/weak boundaries for each ratio. Use all three together: require Sharpe >1.0 for total risk-adjusted quality, Sortino >1.0 for downside protection, and Omega >1.0 for positive expectancy before entering trades.
Momentum tells you WHAT is moving. Risk-adjusted ratios tell you if that movement is worth the risk.
The RATIOS indicator calculates three complementary metrics simultaneously: Sharpe Ratio, Sortino Ratio, and Omega Ratio. Each measures risk-adjusted performance from a different angle.
Sharpe Ratio: Total Volatility Perspective
Formula:
Sharpe Ratio = (Mean Return - Risk-Free Rate) / Standard Deviation × √Annualization FactorInterpretation:
- Sharpe > 2.0: Excellent risk-adjusted performance
- Sharpe 1.0-2.0: Good risk-adjusted performance
- Sharpe < 0.5: Poor risk-adjusted performance
Sharpe treats upside and downside volatility equally. This is why we need Sortino.
Sortino Ratio: Downside Risk Focus
Formula:
Sortino Ratio = (Mean Return - Risk-Free Rate) / Downside Deviation × √Annualization FactorInterpretation:
- Sortino > 2.0: Excellent downside protection
- Sortino 1.0-2.0: Good downside protection
- Sortino < 0.5: Poor downside protection
Sortino only penalizes downside volatility, ignoring upside moves (which traders want).
Omega Ratio: Probability-Weighted Gains vs Losses
Formula:
Omega Ratio = Sum(All Gains Above Target) / Sum(All Losses Below Target)Interpretation:
- Omega > 1.5: Strong (gains significantly exceed losses)
- Omega 1.0-1.5: Acceptable (gains slightly exceed losses)
- Omega < 1.0: Negative expectancy (avoid)
Omega captures the entire distribution of returns, not just mean and standard deviation.
Component 3: The Integrated Decision Matrix
Learn more about the Omega Ratio Pro indicator for advanced position sizing.
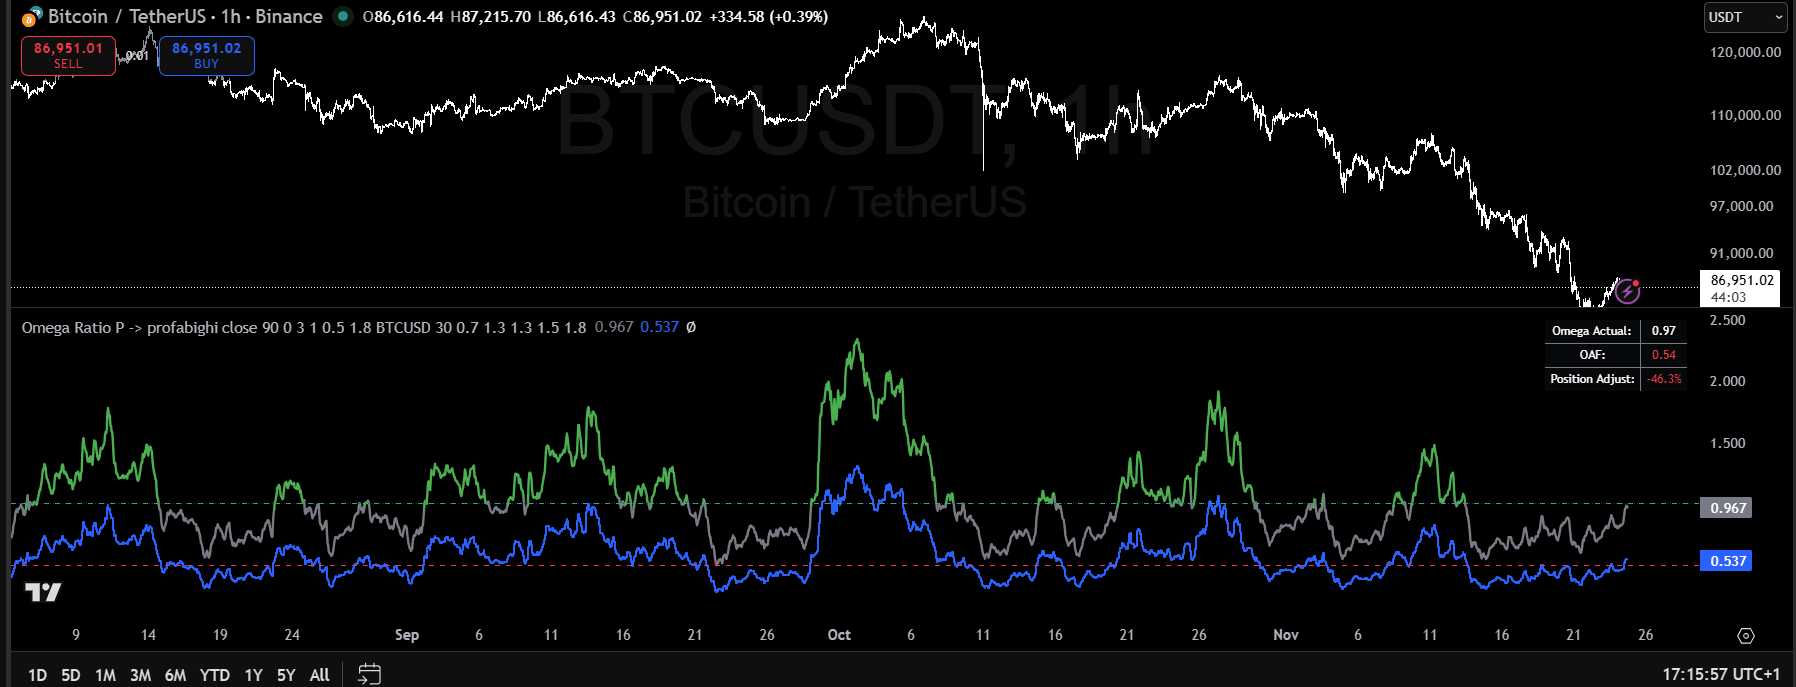
The Omega Ratio Pro indicator dynamically adjusts position sizing based on probability-weighted risk-reward. The primary line shows the Omega Ratio with color-coded visualization: green when above the strong threshold (favorable risk-reward where gains significantly exceed losses), red when below the weak threshold (unfavorable conditions where losses exceed gains), and gray when between thresholds (neutral performance). The blue step-line plots the OAF (Omega Adjustment Factor)—the position sizing multiplier that rises above 1.0 when performance exceeds minimum standards (recommending increased exposure) and falls below 1.0 when performance falls short (recommending reduced exposure). The yellow step-line shows the Adaptive Omega Minimum threshold that adjusts based on beta regime—rising during high-volatility periods requiring stringent standards, falling during low-volatility periods allowing lenient standards. The right panel displays three key metrics: Omega Actual (current ratio value), OAF (the position sizing multiplier), and Position Adjust (percentage to increase or decrease exposure). A blue dotted horizontal line at 1.0 marks the OAF neutral reference where no position adjustment is recommended. Use the Position Adjust percentage as direct portfolio guidance—positive values increase allocation, negative values reduce allocation.
Now that you understand Advanced ROC and Risk-Adjusted Ratios individually, here's how to combine them for high-probability trades.
The Three-Layer Filter System
Layer 1: Momentum Confirmation (Advanced ROC)
- Is Medium ROC positive (bullish) or negative (bearish)?
- Is trend strength Strong, Moderate, or Weak?
- Is there triple ROC alignment?
- Are there any divergences signaling reversal?
Layer 2: Risk-Adjusted Quality (RATIOS)
- Sharpe Ratio > 1.0? (Good total risk-adjusted returns)
- Sortino Ratio > 1.0? (Good downside protection)
- Omega Ratio > 1.0? (Gains exceed losses)
Layer 3: Position Sizing (Combined Signals)
Base Position = 5% of portfolio

Momentum Multiplier:
- Strong trend + Triple alignment: 1.5x
- Moderate trend: 1.0x
- Weak trend: 0.5x

Risk-Adjusted Multiplier:
- All ratios > 2.0: 1.5x
- All ratios > 1.0: 1.0x
- Any ratio < 1.0: 0.5x

OAF Multiplier:
- OAF > 1.2: 1.2x
- OAF 0.8-1.2: 1.0x
- OAF < 0.8: 0.8x

Final Position = Base × Momentum Multiplier × Risk-Adjusted Multiplier × OAF Multiplier

Maximum: 15% per position
Minimum: 1% per position
Key Rules
- Never trade negative ROC, regardless of ratios
- Never trade Omega < 1.0, regardless of momentum
- Reduce size by 50% if any ratio < 1.0
- Increase size by 50% if all ratios > 2.0 AND strong momentum
- Exit immediately on bearish divergence, regardless of ratios
Implementation
Indicators (TradingView):
Settings:
- Advanced ROC: Fast=7, Medium=14, Slow=21, OB=10, OS=-10
- RATIOS: CalcPeriod=90, SmoothPeriod=3, Annualization=365
- Omega Ratio Pro: CalcPeriod=90, EnableOAF=true, EnableBetaAdaptive=true
Daily Workflow:
- Scan for positive Medium ROC
- Check trend strength (Strong/Moderate only)
- Verify all ratios > 1.0
- Check for divergences
- Calculate position size
- Enter if all conditions met
Indicators Used:
All available on TradingView.