Smart Position Sizing: Beta, Omega & Alpha for Adaptive Trade Sizing
Master adaptive position sizing using Beta for volatility adjustment, Omega Ratio for win/loss analysis, and Alpha for skill measurement. Size trades based on market conditions.
Profabighi Capital Research Team
January 27, 2026
Trading Risk Warning
Trading Risk Warning: Trading involves substantial risk of loss and is not suitable for all investors. Past performance does not guarantee future results. You should carefully consider your financial situation and consult with financial advisors before making any investment decisions.

Most traders use the same position size for every trade. 5% here, 5% there.
But here's the problem: a 5% position in a calm asset carries completely different risk than 5% in a wild, volatile asset.
Same size. Totally different risk.
The solution? Use Beta, Omega, and Alpha to automatically adjust your position sizes based on what the market is actually doing.
The Problem with Fixed Sizing
Let's say you always trade 5% positions.
Asset A: Beta 0.5 - when the market moves 10%, this moves 5%
Asset B: Beta 2.0 - when the market moves 10%, this moves 20%
Same 5% position, but Asset B carries 4x the market risk.
When the market crashes, Asset A drops half as much. Asset B drops twice as much.
You need different sizes for different risk levels.
The Framework: Three Indicators + Portfolio View
Single Asset Indicators (for individual analysis):
- Beta - How much does this move vs the market?
- Omega Ratio - Are gains bigger than losses?
- Alpha - Am I actually making money?
Portfolio Trackers (for comparing multiple assets):
- Beta Tracker - Compare Beta across 33 assets at once
- Alpha Tracker - Compare Alpha across 33 assets at once
The trackers let you see your whole portfolio in one view and spot which assets need bigger or smaller positions.
![]()
The Beta Tracker dashboard displays Beta coefficients for up to 33 cryptocurrency assets simultaneously in a sortable table format. Each asset shows its Beta value with regime indicators displayed as colored circles—the color spectrum ranges from red (higher Beta, more volatile) through yellow (moderate Beta) to green (lower Beta, less volatile). The dashboard includes H/M/L text labels alongside the colored circles, a median Beta calculation, and highlights the top Beta assets.
Part 1: Beta - The Volatility Meter
Beta tells you if an asset is calm or wild compared to the market.
Beta 0.5 → Moves half as much (calmer)
Beta 1.0 → Moves with the market (normal)
Beta 2.0 → Moves twice as much (wilder)
How It's Calculated:
Beta = Covariance(Asset Returns, Market Returns) / Variance(Market Returns)Position Sizing Rule:
Beta Multiplier = 1 / Beta

Examples:
- Beta 0.5 → Multiplier = 2.0x (can double size)
- Beta 1.0 → Multiplier = 1.0x (normal size)
- Beta 2.0 → Multiplier = 0.5x (cut size in half)
Beta Regimes:
- Low Beta (< 0.7): Less sensitive than market → Can size larger
- Medium Beta (0.7-1.3): Normal sensitivity → Standard sizing
- High Beta (> 1.3): More sensitive than market → Size smaller
Beta Momentum (Early Warning System):
Beta Tracker can show you when Beta is accelerating - this warns you BEFORE volatility fully hits.
Beta Momentum = (Current Beta - Beta 30 days ago) / 30

Warning Levels:
- Momentum > 0.03 → 🟠 Beta accelerating (reduce positions 20%)
- Momentum > 0.05 → 🔴 Regime shift imminent (reduce positions 40%)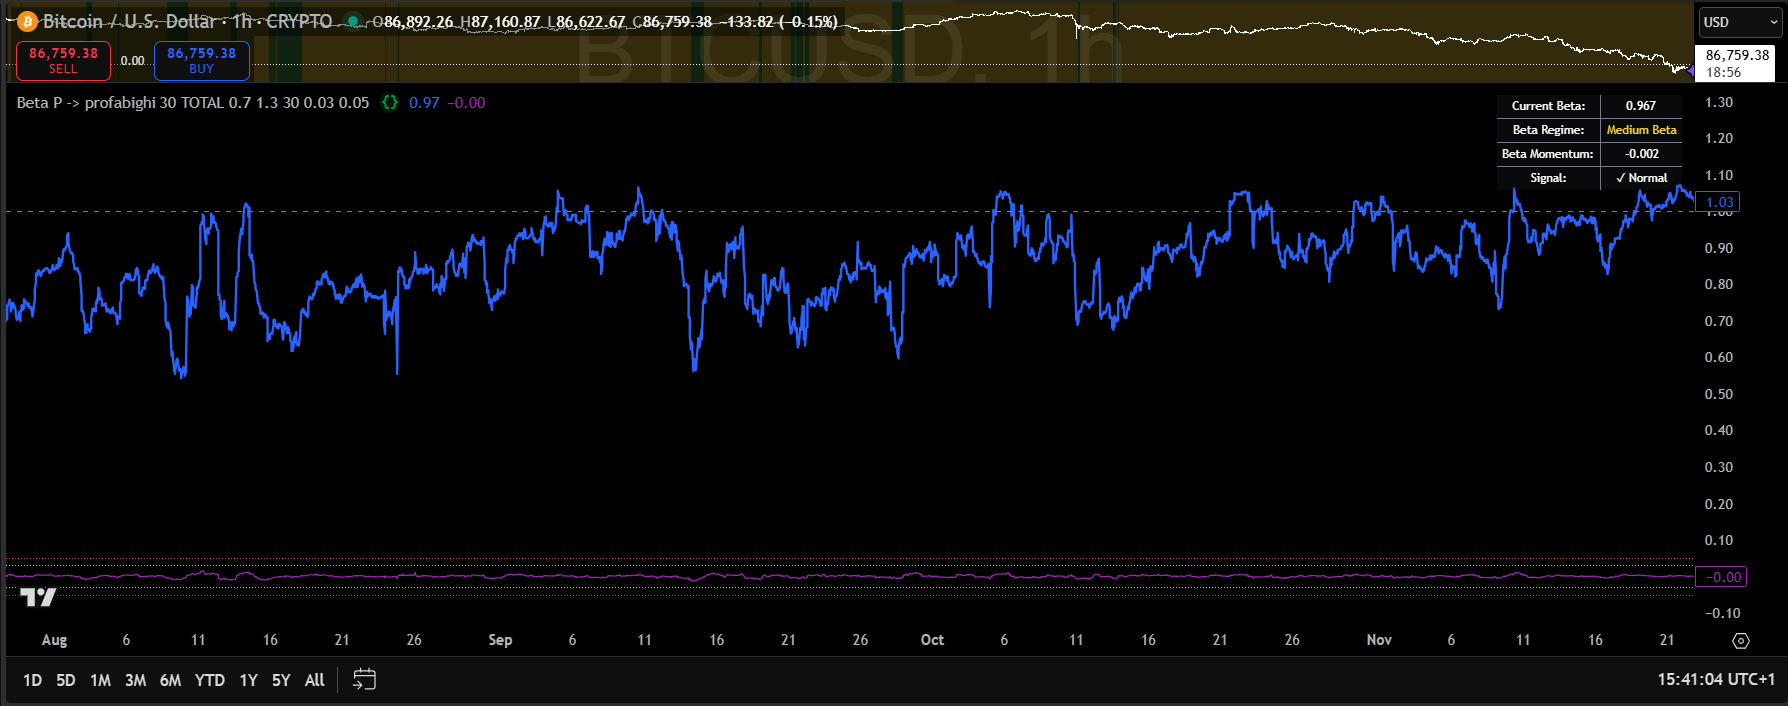
The Beta indicator displays as a line oscillating around a 1.00 reference line, with an info box showing current Beta value, Beta regime classification, Beta Momentum, and signal status. The indicator tracks how an asset's volatility compares to the benchmark over a rolling period. Lower Beta readings indicate the asset is less volatile than the market—often signaling reduced correlation or defensive characteristics. Higher Beta readings indicate amplified volatility—signaling increased market sensitivity requiring position size adjustments.
Part 2: Omega Ratio - The Win/Loss Meter
Omega tells you if the setup is good by comparing total gains to total losses.
Omega > 1.5 → Strong (gains way bigger)
Omega 1.0-1.5 → Okay (gains slightly bigger)
Omega < 1.0 → Bad (losses bigger)
How It's Calculated:
Omega = Sum(All Gains Above 0%) / Sum(All Losses Below 0%)Looks at the last 90 bars and adds up all gains vs all losses.
Position Sizing Rule:
If Omega < 1.0 → Skip (or size tiny)
If Omega 1.0-1.5 → Normal size
If Omega > 1.5 → Can increase up to 1.5x
OAF (Omega Adjustment Factor):
The indicator calculates OAF—a position sizing multiplier that translates Omega into actionable allocation guidance:
OAF = Omega Actual / Omega Minimum

If OAF > 1.0 → Increase position size (performance exceeds standards)
If OAF < 1.0 → Decrease position size (performance falls short)

Position Adjustment = (OAF - 1) × 100%
Example: If Omega = 1.8 and Omega Min = 1.5:
- OAF = 1.8 / 1.5 = 1.2
- Position Adjustment = (1.2 - 1) × 100% = +20%
- Increase your position by 20%
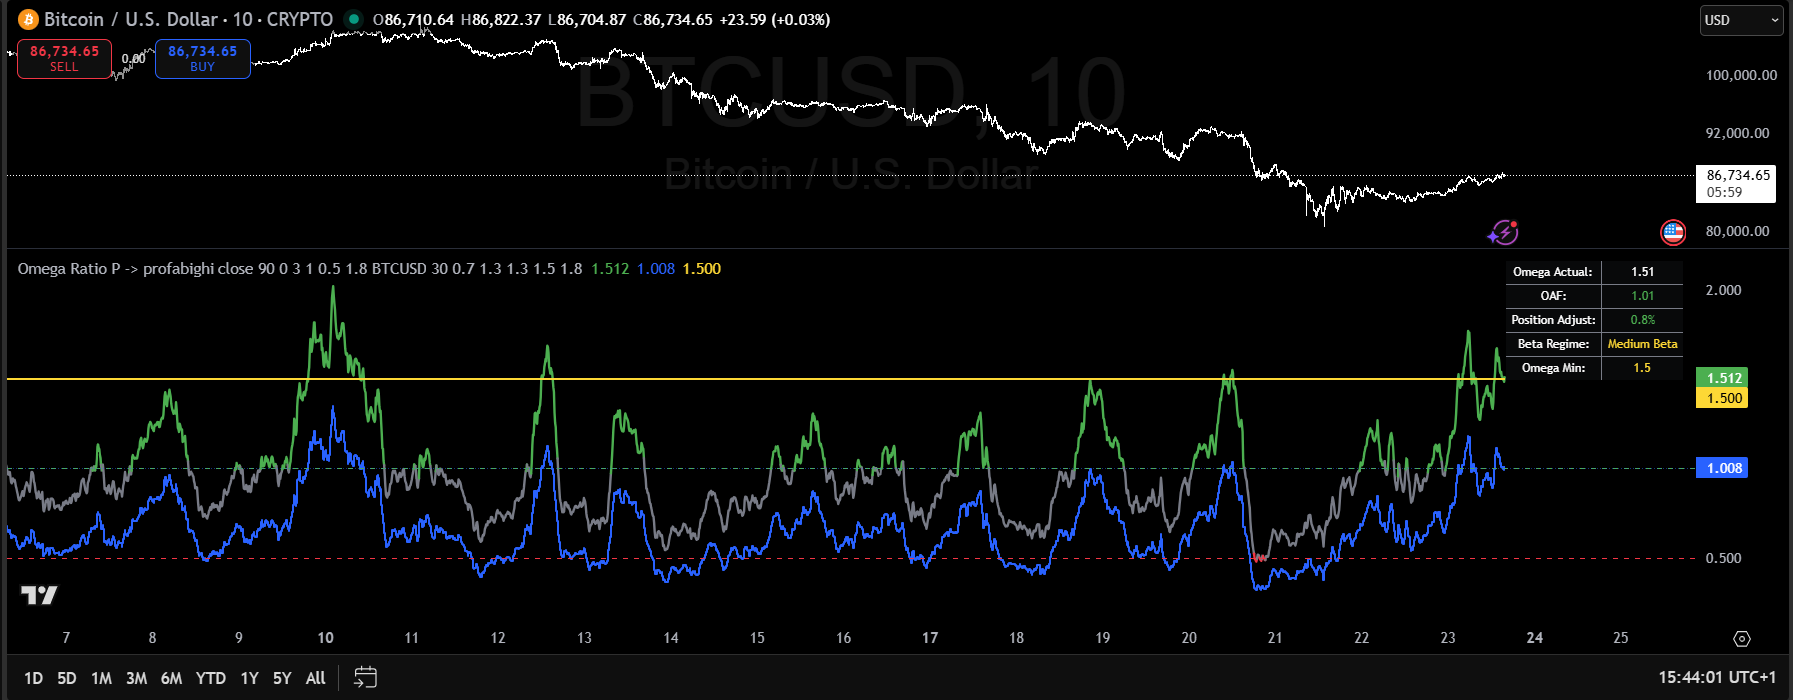
The Omega Ratio indicator displays two key lines: the green line shows smoothed Omega Ratio (gains divided by losses), while the blue line shows OAF (Omega Adjustment Factor)—your position sizing multiplier. The info box displays Omega Actual, Position Adjust percentage, Beta Regime, and Omega Min threshold. Omega measures total gains divided by total losses over a rolling period—higher Omega means gains exceed losses.
Part 3: Alpha - The Skill Meter
Alpha tells you if you're actually adding value or just riding the market.
Alpha > 0 → Beating the market (skill)
Alpha = 0 → Matching the market (no edge)
Alpha < 0 → Losing to the market (strategy failing)
How It's Calculated:
Alpha = Your Return - (Beta × Market Return)Removes market influence to see if YOU are adding value.
Position Sizing Rule:
If Alpha < 0 → Cut size 50% (strategy not working)
If Alpha = 0 → Normal size
If Alpha > 0 → Can increase up to 1.5x
Advanced Features: RAM & APS
RAM (Regime Alpha Multiplier) tells you if your strategy works better in certain Beta regimes:
RAM = Current Regime Alpha / Average Alpha Across All Regimes

- RAM > 1.0 → Strategy stronger in this regime (increase allocation)
- RAM = 1.0 → Average performance (standard allocation)
- RAM < 1.0 → Strategy weaker in this regime (reduce allocation)
APS (Alpha Persistence Score) tells you how consistent your alpha is:
APS = (Positive Alpha Periods / Total Periods in Current Regime) × 100

- APS > 60% → Consistent alpha (reliable strategy)
- APS 40-60% → Inconsistent alpha (use caution)
- APS < 40% → Unreliable alpha (avoid or minimal size)![]()
The Alpha Tracker dashboard displays Alpha coefficients for up to 33 cryptocurrency assets in a sortable table format. Each asset shows its Alpha value with color-coding on a spectrum—greener colors indicate stronger positive Alpha (outperforming the benchmark), while redder colors indicate negative Alpha (underperforming). The dashboard includes momentum icons, a median Alpha calculation, and highlights the top Alpha assets. Positive Alpha means the asset generates excess return beyond what its Beta exposure predicts—this is genuine skill-based outperformance.
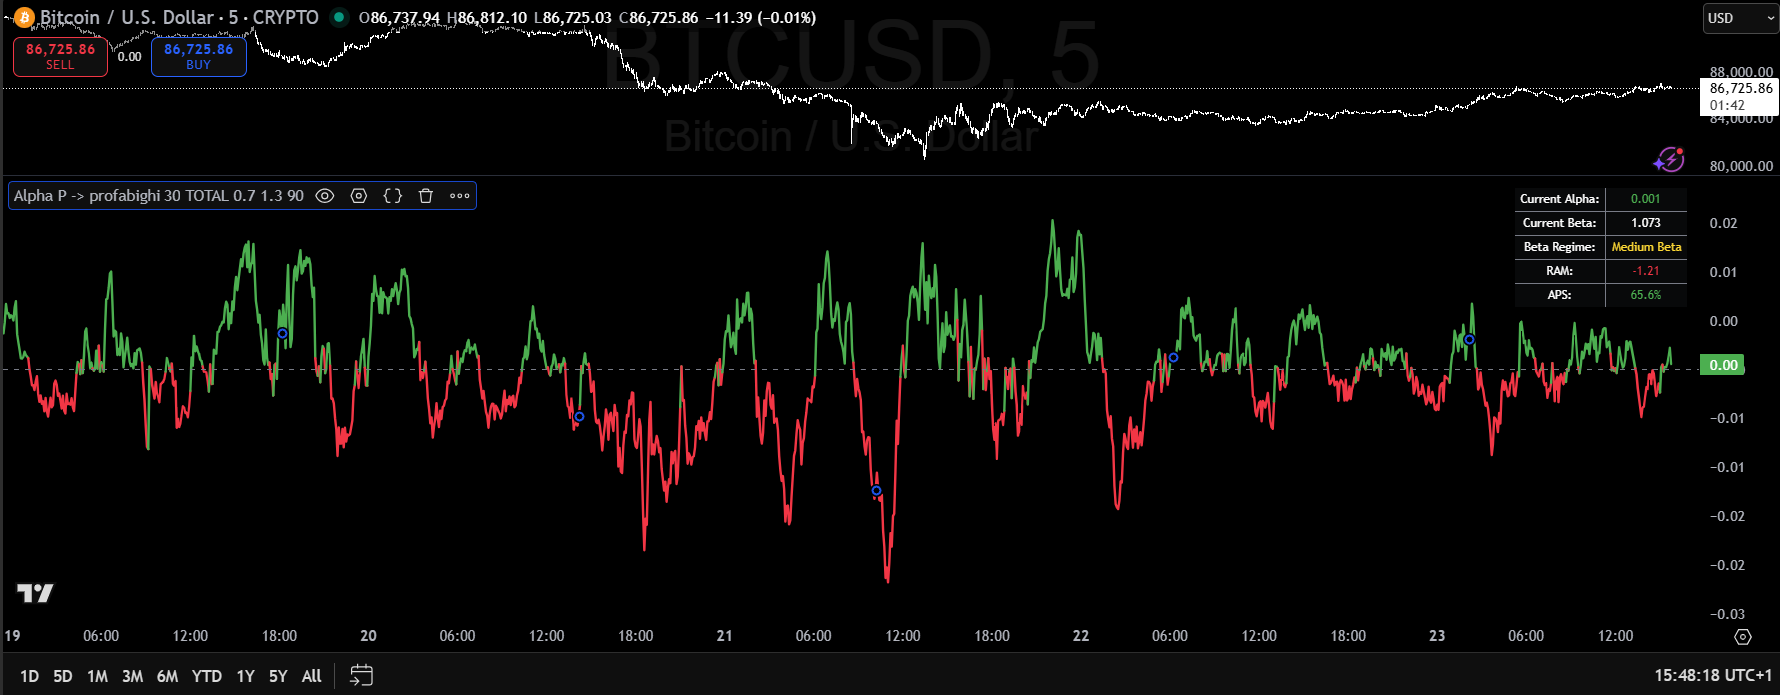
The Alpha indicator displays as an oscillating line around a zero reference line, with color-coding that shifts based on performance—greener when generating positive excess return, redder when underperforming. The info box shows current Alpha value, current Beta, Beta Regime, RAM (Regime Alpha Multiplier), and APS (Alpha Persistence Score). Alpha measures excess return—the difference between actual return and expected return based on Beta exposure. Strong positive Alpha spikes at price lows signal the asset is generating significant excess return relative to its Beta—often preceding reversals.
The Complete Position Sizing Formula
Base Position = Portfolio × Base Risk (typically 3-5%)

Beta Adjustment (BA) = 1 / Beta
Omega Adjustment (OA) = Omega / 1.5 (max 1.5x)
Alpha Adjustment (AA) = 1.0 + (Alpha × 10) (max 1.5x)
RAM Adjustment (RA) = RAM (if APS > 60%, otherwise RAM × 0.5)

Final Position = Base × BA × OA × AA × RA

Maximum: 20%
Minimum: 1%
Hypothetical Scenarios
Scenario 1: Strong Crypto Setup
Indicators:
- Beta: 1.2 (moderate volatility)
- Omega: 1.8 (strong wins)
- Alpha: +0.05 (5% skill)
- RAM: 1.6 (60% better in this regime)
- APS: 85% (very consistent)
Calculation:
Base: 5%
BA: 1/1.2 = 0.83
OA: 1.8/1.5 = 1.2
AA: 1.0 + (0.05 × 10) = 1.5
RA: 1.6 (APS > 60%)

Position: 5% × 0.83 × 1.2 × 1.5 × 1.6 = 12%Result: Above-average position. Strong setup.
Scenario 2: High-Risk Setup
Indicators:
- Beta: 2.5 (very high volatility)
- Omega: 0.7 (losses bigger)
- Alpha: -0.03 (losing 3%)
- RAM: 0.6 (40% worse in this regime)
- APS: 35% (very inconsistent)
Calculation:
Base: 5%
BA: 1/2.5 = 0.4
OA: 0.7/1.5 = 0.47
AA: 1.0 + (-0.03 × 10) = 0.7
RA: 0.6 × 0.5 = 0.3 (APS penalty)

Position: 5% × 0.4 × 0.47 × 0.7 × 0.3 = 0.2%Result: Tiny position or skip entirely. Too risky.
Scenario 3: Mixed Signals
Indicators:
- Beta: 1.0 (normal)
- Omega: 1.6 (favorable)
- Alpha: 0.01 (barely positive)
- RAM: 1.1 (slightly better)
- APS: 65% (acceptable)
Calculation:
Base: 5%
BA: 1/1.0 = 1.0
OA: 1.6/1.5 = 1.07
AA: 1.0 + (0.01 × 10) = 1.1
RA: 1.1 (APS > 60%)

Position: 5% × 1.0 × 1.07 × 1.1 × 1.1 = 6.5%Result: Slightly larger than base due to favorable Omega.
How to Use This
Step 1: Add the Indicators
On TradingView:
- Beta → Profabighi Capital (single asset)
- Beta Tracker → Profabighi Capital (portfolio view)
- Omega Ratio → Profabighi Capital (single asset)
- Alpha → Profabighi Capital (single asset)
- Alpha Tracker → Profabighi Capital (portfolio view)
Step 2: Set Your Benchmark
For crypto:
- Trading altcoins? Use CRYPTOCAP:TOTAL
- Trading Bitcoin? Use a market index
Step 3: Check Before Every Trade
For Single Asset:
- Check Beta - what's the regime? (L/M/H)
- Check Omega - is it above 1.0?
- Check Alpha - is it positive?
For Portfolio View:
- Open Beta Tracker - see all assets' Beta at once
- Open Alpha Tracker - see all assets' Alpha at once
- Sort by top performers
Step 4: Calculate Position
Use the formula, or keep it simple:
Simple Version:
- All indicators good + RAM > 1.2 + APS > 60% → 15% position
- All indicators normal → 5% position
- Any indicator bad OR APS < 60% → 2% or skip
Step 5: Monitor Weekly
- If Beta momentum > 0.15 → Reduce all positions 20%
- If Omega drops < 1.0 → Close or reduce
- If Alpha negative for 2+ weeks → Stop trading this
- If APS drops < 60% → Cut RAM benefit in half
Common Mistakes
Mistake 1: Ignoring Beta Momentum
- Waiting for Beta to spike before adjusting = getting crushed
- Fix: Watch Beta Tracker's momentum column. Reduce when momentum > 0.15
Mistake 2: Trading Low Omega
- Omega < 1.0 means losses exceed gains. Don't fight it.
- Fix: Hard rule - no trades when Omega < 1.0
Mistake 3: Ignoring APS
- High RAM looks great, but if APS is low, that alpha isn't reliable
- Fix: Always check APS. If < 60%, cut RAM benefit by 50%
Mistake 4: Not Using Trackers
- Checking 20 assets one by one = slow and error-prone
- Fix: Use Beta Tracker and Alpha Tracker to see your whole portfolio at once
Mistake 5: Over-Complicating
- Trying to calculate exact multipliers to 3 decimals = analysis paralysis
- Fix: Round to simple numbers. 1.67x becomes 1.5x. Close enough.
Key Takeaways
Beta = market sensitivity - High Beta needs smaller positions
Beta Momentum = early warning - Reduce positions when momentum > 0.15
Omega = win/loss ratio - Only trade when Omega > 1.0
Alpha = your skill - Positive Alpha means strategy works
RAM = regime-specific performance - Shows if strategy works better in certain regimes
APS = consistency check - High RAM means nothing if APS < 60%
Use Trackers for portfolio view - See 33 assets at once instead of checking one by one
Implementation Checklist
- Beta Tracker installed and configured
- Alpha Tracker installed and configured
- Omega Ratio indicator added
- Benchmark set (CRYPTOCAP:TOTAL for altcoins)
- Position sizing formula documented
- Weekly monitoring schedule established
- Beta momentum alerts configured
- Omega threshold alerts set
- Paper trading tested before live implementation
Disclaimer: This content is for educational purposes only and does not constitute financial advice. Trading cryptocurrencies involves substantial risk of loss. Beta, Omega, Alpha, RAM, and APS are based on historical data and do not predict future performance. Always do your own research and never risk more than you can afford to lose.