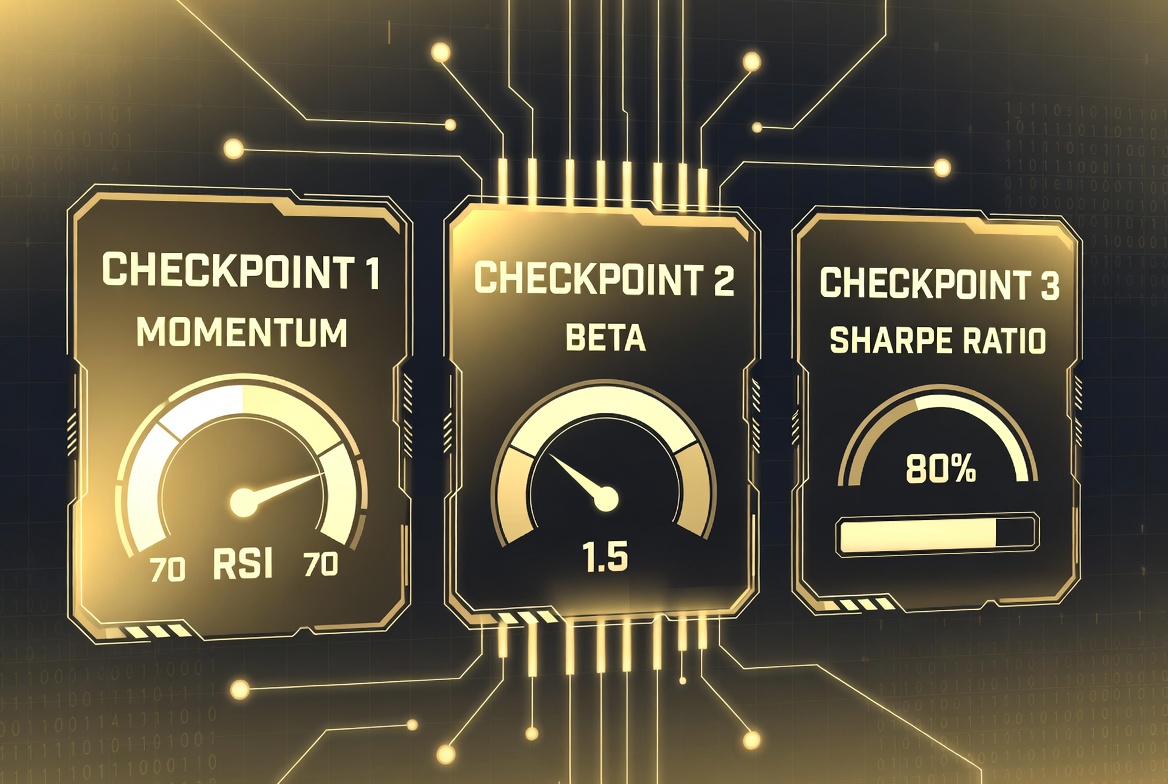
The 3-Checkpoint Crypto Trading System: Momentum RSI, Beta & Sharpe Ratio
Master systematic crypto trading with our three-checkpoint framework combining Momentum RSI for timing, Beta for position sizing, and Sharpe Ratio for risk validation.
Profabighi Capital Research Team
January 25, 2026
Trading Risk Warning
Trading Risk Warning: Trading involves substantial risk of loss and is not suitable for all investors. Past performance does not guarantee future results. You should carefully consider your financial situation and consult with financial advisors before making any investment decisions.
During a major market crash, Bitcoin plummets 30% in 10 days. Two traders, both holding BTC. One panic-sells at every dip, bleeding capital on fees and emotion. The other? Her systematic trading framework shows three clear signals—and she adds a small position during the panic, riding the bounce back up.
The difference wasn't luck. It was a three-checkpoint system that answers the only questions that matter: When to enter, how much to risk, and whether the trade is worth taking at all.
Why Single-Indicator Trading Fails in Crypto Markets
Most traders rely on one indicator. RSI says oversold? Buy. Moving average crosses? Sell. Volume spikes? Enter.
Here's the problem: crypto moves too fast for single indicators.
A stock might take weeks to move 10%. Bitcoin does that before lunch. Your RSI can't keep up. Worse, crypto volatility spikes without warning—one day calm, the next day swinging 15%. That fixed 10% position you always take? It just became 3x riskier overnight.
The solution isn't more indicators. It's the right combination of three that each handle a specific job.
Checkpoint #1: Momentum RSI — Your Entry Timing Filter
Traditional RSI was built for 1970s stock markets. It assumes mean reversion. Crypto doesn't play by those rules.
During strong bull runs, Bitcoin's RSI can stay above 70 for months. Traders who sell "overbought" often miss massive moves of 100%+ because traditional RSI doesn't account for sustained momentum.
Momentum RSI solves this by combining two concepts:
- RSI: Measures if an asset is overbought/oversold
- Momentum: Measures the speed of price changes
Traditional RSI tells you "Bitcoin is oversold." Momentum RSI tells you "Bitcoin is oversold AND the selling pressure is slowing down."
How to Read It
The indicator moves between 0-100:
- Below 30: Oversold territory
- 30-70: Neutral zone
- Above 70: Overbought territory
But you don't just look at the number. You look at the direction.
Bullish Signal: Momentum RSI crosses above 30 and starts rising
- Translation: "Selling pressure is easing, buyers stepping in"
Bearish Signal: Momentum RSI crosses below 70 and starts falling
- Translation: "Buying pressure fading, sellers taking over"
**Pro Tip**: During market crises, traditional RSI can show oversold for weeks while price keeps falling. Momentum RSI catches the shift earlier—when the indicator starts rising from oversold, even though price is still falling. This divergence signals that selling pressure is weakening before price actually recovers.
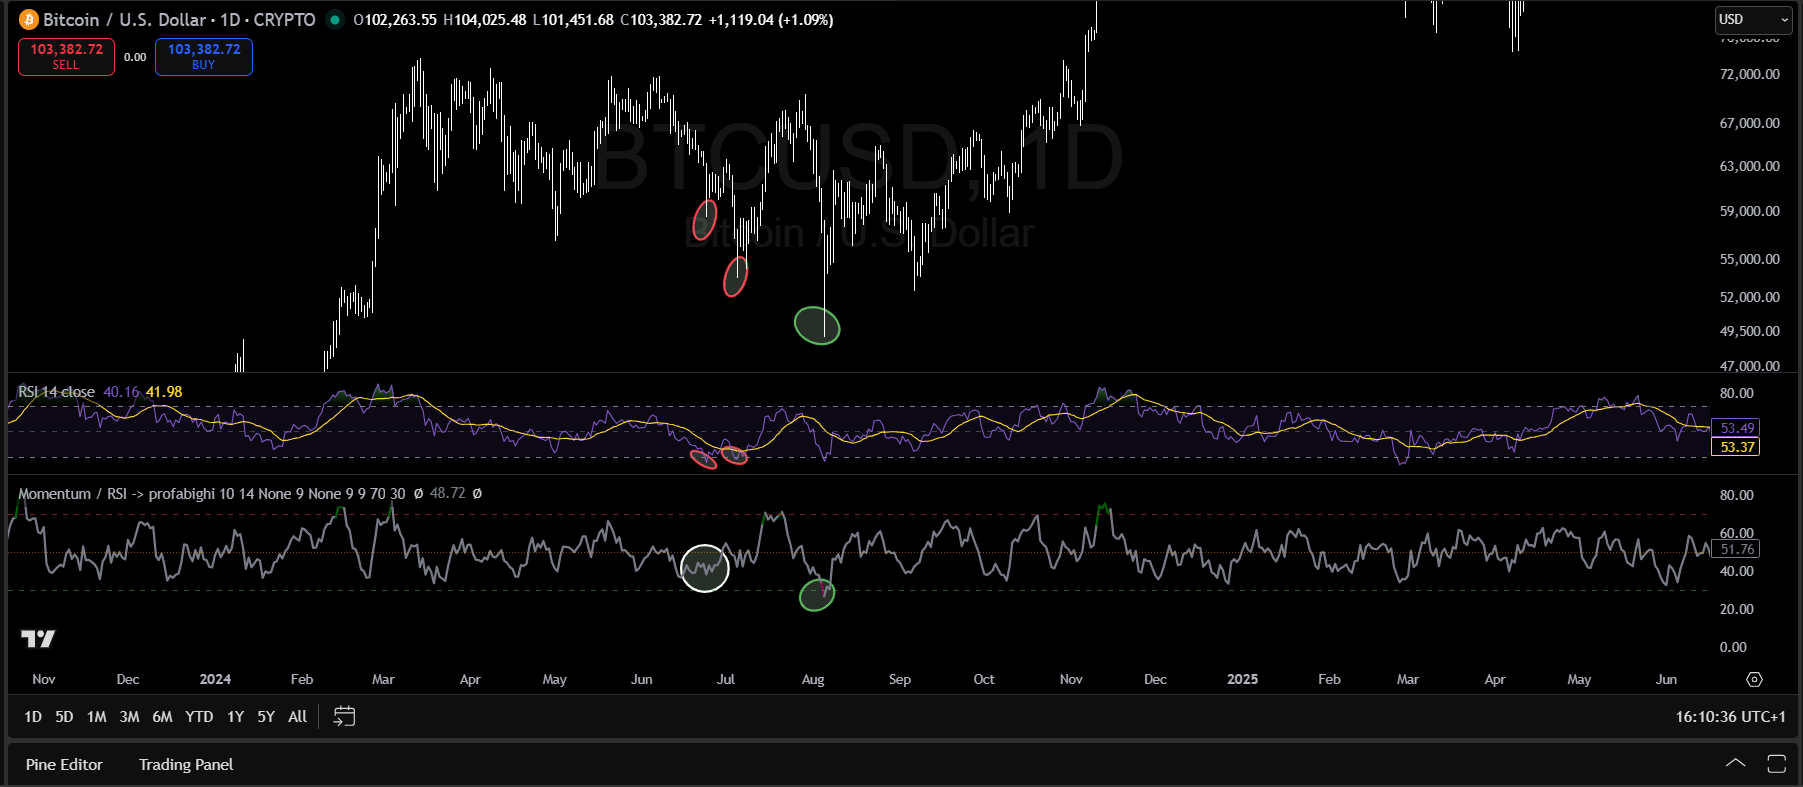
Momentum RSI captures momentum shifts before price confirms, giving traders earlier entry and exit signals during volatile crypto market conditions.
Checkpoint #2: Beta — Your Volatility-Aware Position Sizing Tool
Here's the mistake that kills accounts: using the same position size regardless of how volatile the asset is.
You always trade 10% of your account. Works fine when Bitcoin moves 2% daily. Then you switch to a memecoin moving 15% daily. Same 10% position, but now you're taking 7x more volatility risk. You didn't change your strategy, but your risk just exploded.
Beta measures how volatile an individual crypto asset is compared to the total crypto market capitalization. Think of it as a "volatility multiplier" that shows how much an asset swings relative to the overall crypto market.
- Beta = 1.0: Moves in sync with the total crypto market
- Beta = 1.5: 50% more volatile than the overall crypto market
- Beta = 2.0: Twice as volatile as the crypto market
The Dynamic Sizing Formula
Position Size = Base Size ÷ Beta
This formula does NOT tell you to "avoid volatility." It tells you to match your position size to the volatility you're taking.
Example 1 - Low Beta Asset:
- Base position: 10% of capital
- Asset Beta: 0.5 (half as volatile as market)
- Adjusted position: 10% ÷ 0.5 = 20%
- Reality check: You CAN take 20%, but this asset has limited upside. Is that what you want?
Example 2 - High Beta Asset:
- Base position: 10% of capital
- Asset Beta: 2.0 (twice as volatile as market)
- Adjusted position: 10% ÷ 2.0 = 5%
- Strategic insight: 5% of a high-Beta asset can deliver the same dollar gains as 20% of a low-Beta asset, with better risk management
Beta Classification
- Low Beta (< 0.8): Less volatile than the market — defensive plays, capital preservation
- Normal Beta (0.8-1.2): Moves with the market — standard crypto volatility
- High Beta (1.2-2.0): More volatile than the market — higher risk AND higher potential reward
- Extreme Beta (> 2.0): Significantly more volatile — only for highest conviction setups
**Pro Tip**: High Beta isn't your enemy—it's your opportunity for asymmetric gains. The key is sizing appropriately. A 5% position in a 2.0 Beta asset with perfect momentum and Sharpe can outperform a 20% position in a 0.5 Beta asset.
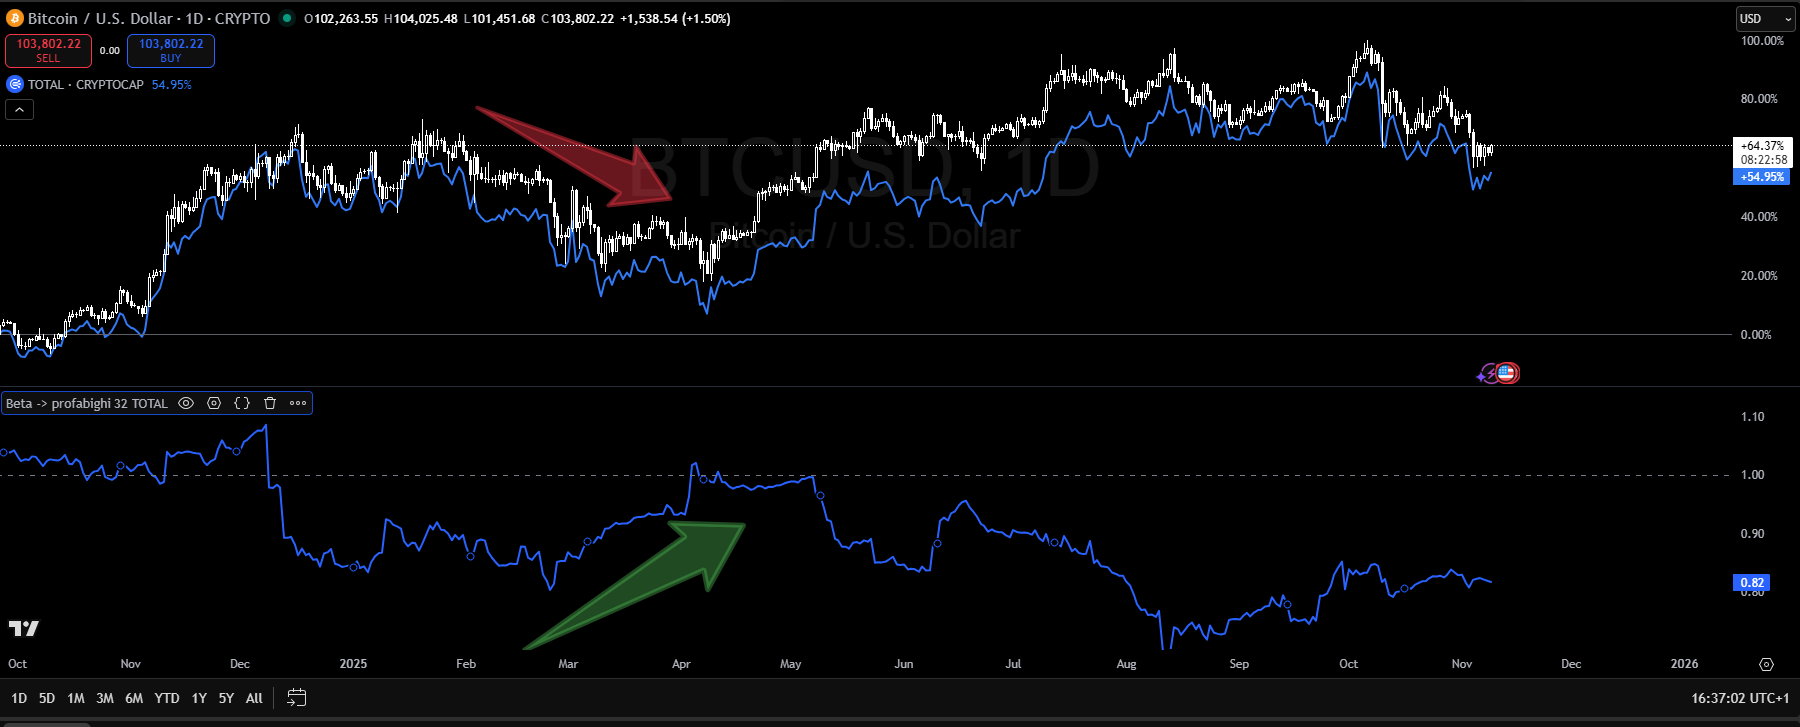
Beta Tracker automatically calculates position size adjustments based on current market volatility, ensuring consistent risk exposure across different assets.
Checkpoint #3: Sharpe Ratio — Your Risk Validation Filter
The Sharpe Ratio is the gold standard for measuring risk-adjusted returns. It tells you how much return you're getting for each unit of risk you're taking.
Sharpe Ratio = (Return - Risk-Free Rate) / Volatility
Think of it as your "bang for buck" metric. A higher Sharpe means better risk-adjusted returns—you're getting more reward for the risk you're taking.
How to Read It
- Below 1.0: Poor risk-adjusted returns
- 1.0-1.5: Average (acceptable but not great)
- 1.5-2.0: Good (solid risk-adjusted performance)
- Above 2.0: Excellent (exceptional risk-adjusted returns)
Use It as Your Final Filter
Scenario 1: Momentum RSI says "buy" and Beta is acceptable
- Check Sharpe: If above 1.5 → Take the trade
- Check Sharpe: If below 1.5 → Wait for better setup
Scenario 2: Comparing two potential trades
- Both have good momentum signals
- Both have similar Beta
- Choose the one with higher Sharpe (better risk-adjusted returns)
**Pro Tip**: During rapid rallies, some altcoins move more than Bitcoin but with terrible Sharpe ratios—meaning you're taking massive risk for the returns. Major assets like Bitcoin often maintain Sharpe above 1.5, signaling better risk-adjusted performance even when absolute gains are smaller.
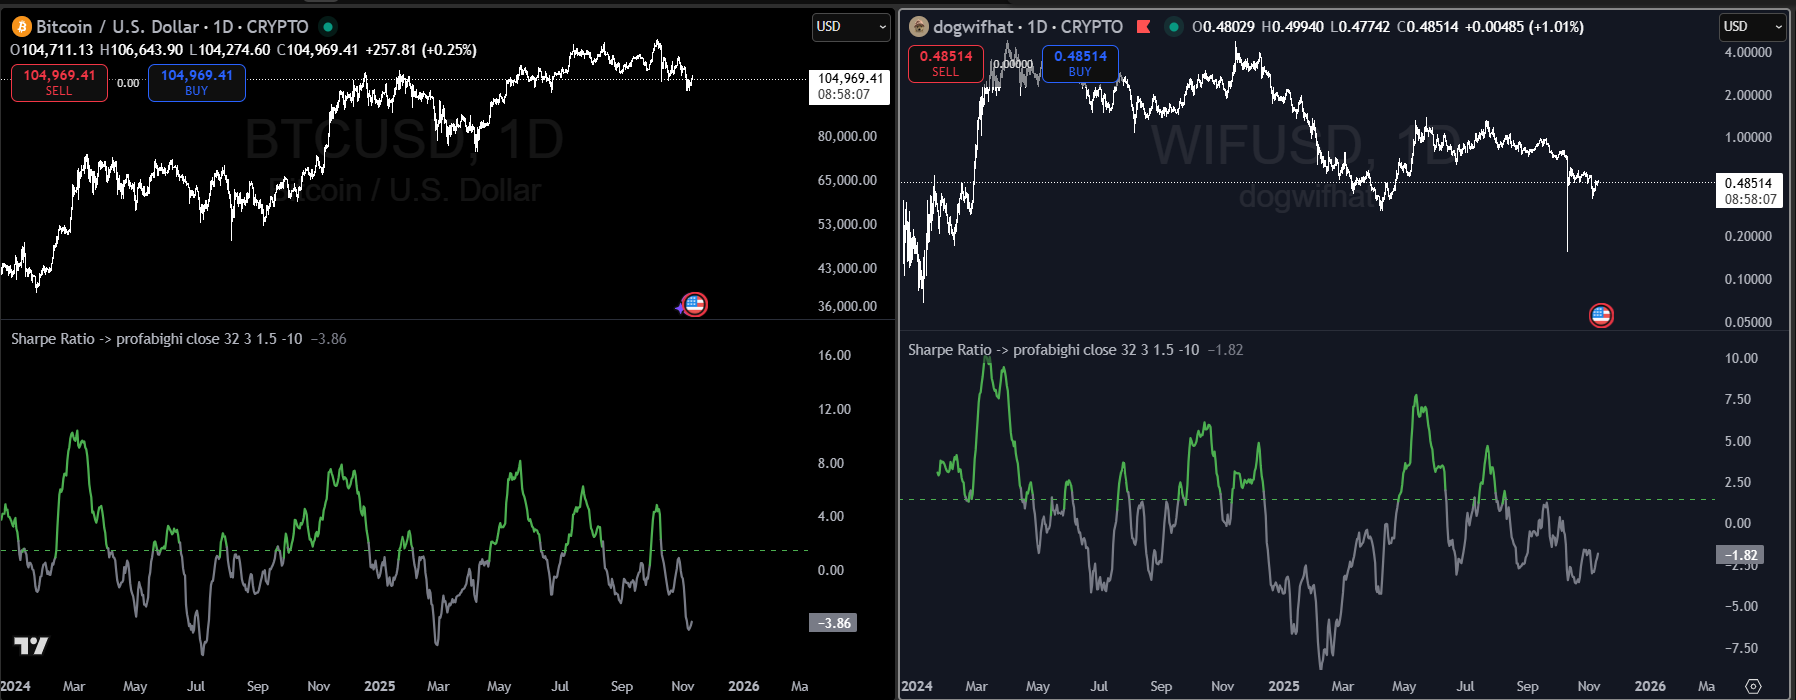
Sharpe Ratio Tracker validates whether the risk-adjusted returns justify taking the trade, preventing entries into setups with poor risk-reward profiles.
The Three-Stage Decision Framework
Think of it as a three-stage filter:
Stage 1 - Timing (Momentum RSI)
- Question: "Is momentum shifting in my favor?"
- If NO → Don't trade
- If YES → Move to Stage 2
Stage 2 - Sizing (Beta Tracker)
- Question: "What's the volatility profile, and how should I size?"
- Calculate position size based on current Beta: Position Size = Base ÷ Beta
- High Beta → Smaller position (but potentially higher reward if other checkpoints align)
- Low Beta → Larger position allowed (but check if you want low-volatility exposure)
- Move to Stage 3 regardless of Beta level
Stage 3 - Validation (Sharpe Ratio)
- Question: "Are the risk-adjusted returns acceptable?"
- If Sharpe < 1.5 → Don't trade (poor risk-adjusted returns)
- If Sharpe > 1.5 → Take the trade with Beta-adjusted size
Real-World Example: Bitcoin Consolidation Setup
Setup: Bitcoin consolidating after weeks of sideways price action
Stage 1 - Check Momentum RSI:
- Reading: 35 and rising (crossed above 30)
- Interpretation: Oversold conditions improving
- Decision: ✓ Timing looks good
Stage 2 - Check Beta:
- Reading: 1.2 (20% more volatile than total crypto market)
- Interpretation: Higher volatility means higher potential reward, but requires smaller position
- Position Adjustment: 10% ÷ 1.2 = 8.3% position (reduced from base 10%)
- Decision: ✓ Position sized appropriately for volatility profile
Stage 3 - Check Sharpe:
- Reading: Good risk-adjusted returns
- Interpretation: Favorable risk-reward profile
- Decision: ✓ Risk-adjusted returns are favorable
Final Decision: Enter with Beta-adjusted position size
Adapting to Different Market Conditions
Bull Market (Trending Up)
- Momentum RSI: Focus on buying dips (RSI 30-40)
- Beta: Often elevated as assets outperform—this is GOOD (higher volatility = higher gains)
- Sharpe: Generally higher, easier to find good setups
- Strategy: Accept higher Beta positions when Sharpe justifies it, take more trades
Bear Market (Trending Down)
- Momentum RSI: Focus on selling rallies (RSI 60-70)
- Beta: Often drops as assets underperform market—low Beta here signals weakness
- Sharpe: Lower, be very selective
- Strategy: Defensive, fewer trades, be cautious of "safe-looking" low Beta assets
Sideways Market (Choppy)
- Momentum RSI: Many false signals, less reliable
- Beta: Can be deceptive
- Sharpe: Often poor
- Strategy: Wait for clearer conditions or trade less
Key Principles for System Success
All Three Must Align — Don't cherry-pick. If only one or two indicators look good, wait.
Beta Adjustment Is Non-Negotiable — Never override the Beta-adjusted position size. It's your automatic risk control.
Sharpe Is Your Veto Power — Even if momentum and Beta look perfect, poor Sharpe means skip the trade.
Adapt To Market Regimes — Bull markets = more trades. Bear markets = fewer, smaller trades.
Patience Pays — Most of the time, all three won't align. That's okay. The system keeps you out of mediocre setups.
Indicators Used in This Framework
This three-checkpoint system uses the following TradingView indicators from Profabighi Capital:
- Momentum RSI — Entry timing filter combining RSI with momentum analysis
- Beta — Volatility-aware position sizing tool measuring asset volatility vs total crypto market
- Sharpe Ratio — Risk validation filter for risk-adjusted return assessment
- Momentum Risk Validator — Additional validation layer combining momentum and risk metrics
All indicators are available on TradingView under the Profabighi Capital profile.
What This System Does (and Doesn't Do)
What it does well:
- Keeps you out of bad trades
- Automatically adjusts to volatility
- Focuses on downside protection
- Removes emotional decision-making
What it doesn't do:
- Catch every move
- Work in all market conditions
- Guarantee profits
- Replace your judgment entirely
This isn't a "get rich quick" system. It's a framework for making consistent, risk-managed decisions in volatile crypto markets.
Your Next Step
Test this system on your last 10 trades. How many would have passed all three filters? How would Beta adjustment have changed your position sizes?
Understanding this retrospectively builds confidence for future application.
The crypto markets will test your discipline. But with a systematic approach that combines timing, sizing, and validation, you can navigate the volatility chaos.