Risk-Adjusted Momentum Engine: RSI + Advanced ROC + Sortino Ratio
Complete framework for combining RSI momentum identification with Advanced ROC trend confirmation and Sortino Ratio downside protection. Learn how to capture trending moves while avoiding catastrophic drawdowns through systematic risk-adjusted momentum trading.
Profabighi Capital Research Team
January 12, 2026
Trading Risk Warning
Trading Risk Warning: Trading involves substantial risk of loss and is not suitable for all investors. Past performance does not guarantee future results. You should carefully consider your financial situation and consult with financial advisors before making any investment decisions.

A trader spots strong RSI momentum. The trend looks solid. They enter with full position size.
Three weeks later, they've given back all gains plus 20% more. The momentum was real—but the risk-adjusted quality was terrible. When the trend reversed, there was no downside protection.
This is the fundamental problem with momentum trading: capturing strong trends without suffering catastrophic drawdowns during reversals. Traditional momentum approaches capture most of the trend but give back significant portions during reversals.
The Risk-Adjusted Momentum Engine solves this by integrating risk at every decision point through three complementary layers:
- RSI Analysis — Momentum foundation and overbought/oversold identification
- Advanced ROC Confirmation — Multi-period trend validation and sustainability
- Sortino Risk Filter — Downside protection before any entry
Together, these components create a simple checklist approach—only trade when all three indicators show green lights.
The Problem with Momentum-Only Trading
Most momentum traders use RSI or ROC in isolation. They see RSI crossing above 50 and buy. They see strong upward momentum and increase position size.
But momentum alone is incomplete. It measures velocity without measuring quality.
The Critical Questions Momentum Can't Answer:
- Is this momentum sustainable or about to reverse?
- What's the downside risk if the trend fails?
- Are gains larger than losses during this momentum phase?
- Does the risk profile justify the potential reward?
The Pattern That Destroys Accounts:
Asset shows RSI at 65 with positive ROC (strong momentum). Trader enters long position with full size.
But hidden context reveals:
- Sortino Ratio = 0.8 (poor downside protection)
- ROC is decelerating (momentum weakening)
- No multi-timeframe confirmation
When momentum reversed, losses amplified because there was no risk filter in place.
The Solution:
Combine RSI momentum identification with ROC trend confirmation and Sortino downside protection. Only trade momentum when all three layers align.
Component 1: Momentum RSI Analysis — The Momentum Foundation
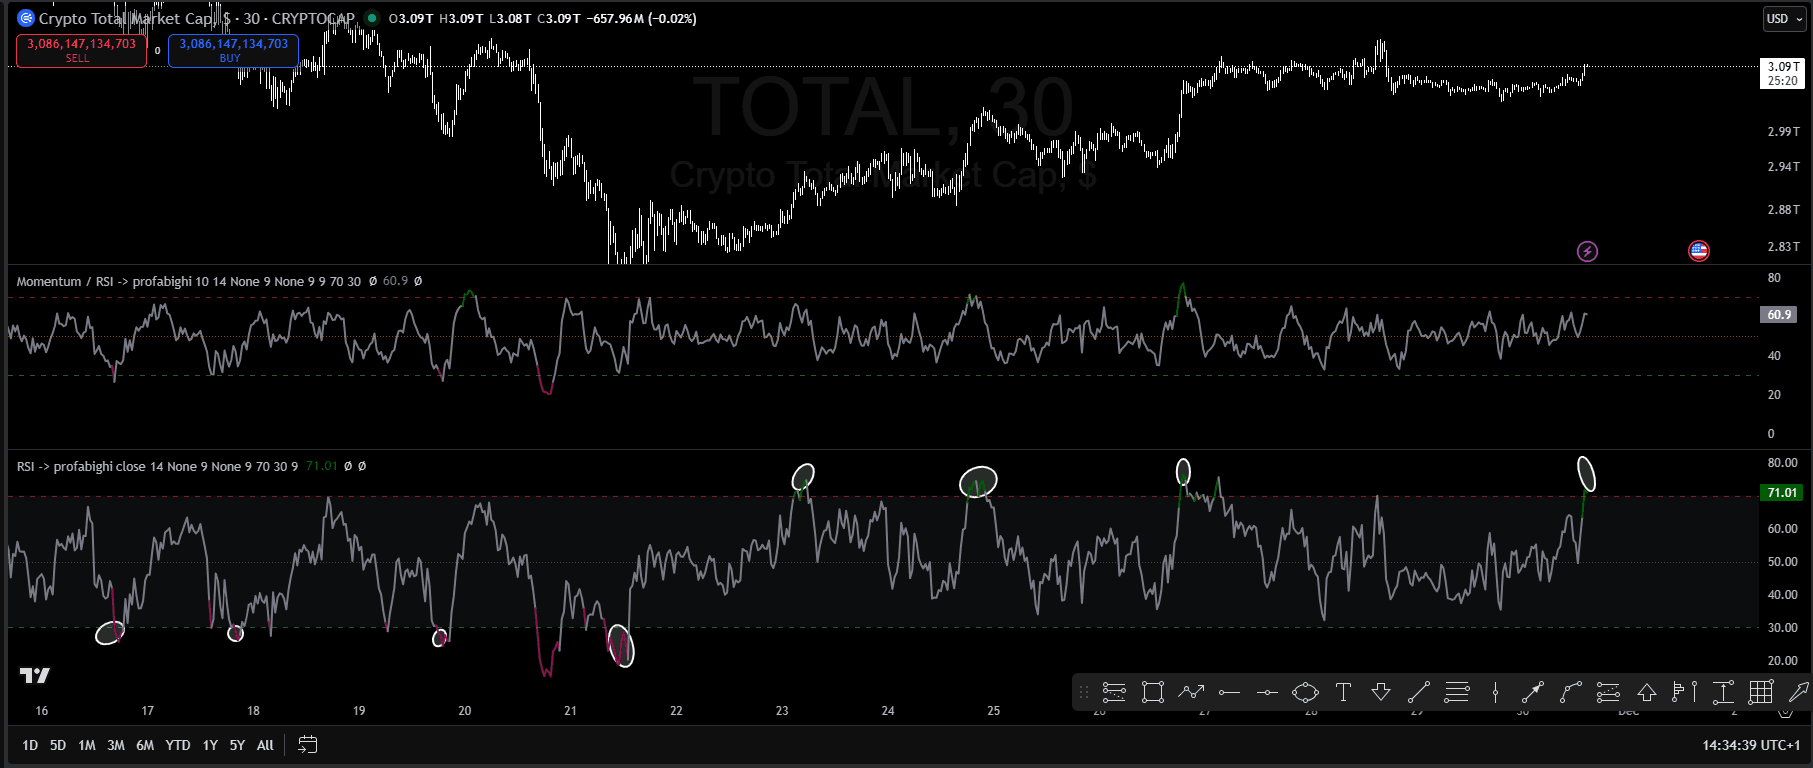
Two-panel comparison: RSI (Panel 2, reading 60.9) vs Momentum/RSI (Panel 3, reading 71.01). White circles mark overbought/oversold zones on both indicators. The Momentum/RSI indicator consistently identifies tops and bottoms more accurately than standard RSI—notice how Momentum/RSI reaches extreme levels earlier, providing better entry/exit timing.
The Momentum RSI indicator provides a unique two-layer momentum analysis. Unlike traditional RSI that measures price momentum directly, this indicator first calculates Momentum, then applies RSI to that Momentum value—giving you momentum of momentum.
What Momentum RSI Measures
Two-Stage Calculation:
Step 1: Calculate Momentum
Momentum = Close - Close[N periods ago]
Where N = Momentum Period (configurable, default 10)

Step 2: Apply RSI to Momentum
RSI = 100 - (100 / (1 + RS))
Where RS = Average Gain / Average Loss of MOMENTUM over M periods
Where M = RSI Period (configurable, default 14)
The indicator has two display modes:
- Momentum Mode (default): Shows raw momentum with green (positive) / red (negative) coloring
- RSI Mode: Shows RSI applied to momentum with 70/30 extreme levels
Optional smoothing through multiple MA types (SMA, EMA, WMA, HMA, RMA, LSMA, DEMA, TEMA, VIDYA).
Momentum Mode Interpretation
When showSmoothedRsi = false (default), the indicator displays raw Momentum:
- Green Line: Momentum > 0 (price rising faster than N periods ago)
- Red Line: Momentum < 0 (price falling compared to N periods ago)
- Zero Line: Key reference—crossovers signal momentum shifts
RSI Mode Zone Classification
When showSmoothedRsi = true, the indicator displays RSI of Momentum:
- Overbought Zone (RSI > 70): DO NOT BUY - Too late to enter, high reversal risk, consider taking profits
- Neutral-Bullish (RSI 50-70): Moderate momentum, acceptable entry zone
- Optimal Entry (RSI 40-60): Best entry zone - pullback in uptrend, ideal risk/reward
- Neutral-Bearish (RSI 30-50): Weak momentum, caution warranted
- Oversold Zone (RSI < 30): Potential reversal opportunity, but confirm with other indicators
Color Coding in RSI Mode:
- Dark Green: RSI > 70 (extreme high)
- Gray: RSI between 30-70 (neutral zone)
- Dark Red (Maroon): RSI < 30 (extreme low)
Momentum RSI Scoring
For the checklist, Momentum RSI zones determine the signal:
For Long Positions:
- RSI 70-100: RED LIGHT (OVERBOUGHT - DO NOT BUY, too late, reversal risk)
- RSI 50-70: YELLOW LIGHT (moderate momentum, acceptable but reduce size)
- RSI 40-60: GREEN LIGHT (OPTIMAL ENTRY ZONE - pullback in uptrend)
- RSI 30-50: YELLOW LIGHT (weak/neutral, reduced confidence)
- RSI 0-30: YELLOW LIGHT (oversold, potential reversal but confirm with other indicators)
Divergence Detection
Bullish Divergence:
- Price makes lower low
- Momentum RSI makes higher low
- Signal: Momentum acceleration improving despite price weakness
Bearish Divergence:
- Price makes higher high
- Momentum RSI makes lower high
- Signal: Momentum acceleration weakening despite price strength
Divergences provide early warning of trend exhaustion before price actually reverses.
Optimal Entry Zones
- Optimal Long Entry: Momentum RSI 40-60 (pullback in uptrend)
- Aggressive Long Entry: Momentum RSI 50-70 (momentum confirmation)
- Avoid: Momentum RSI > 80 (overextended) or < 40 (weak momentum)
Component 2: Advanced ROC Confirmation — Trend Validation
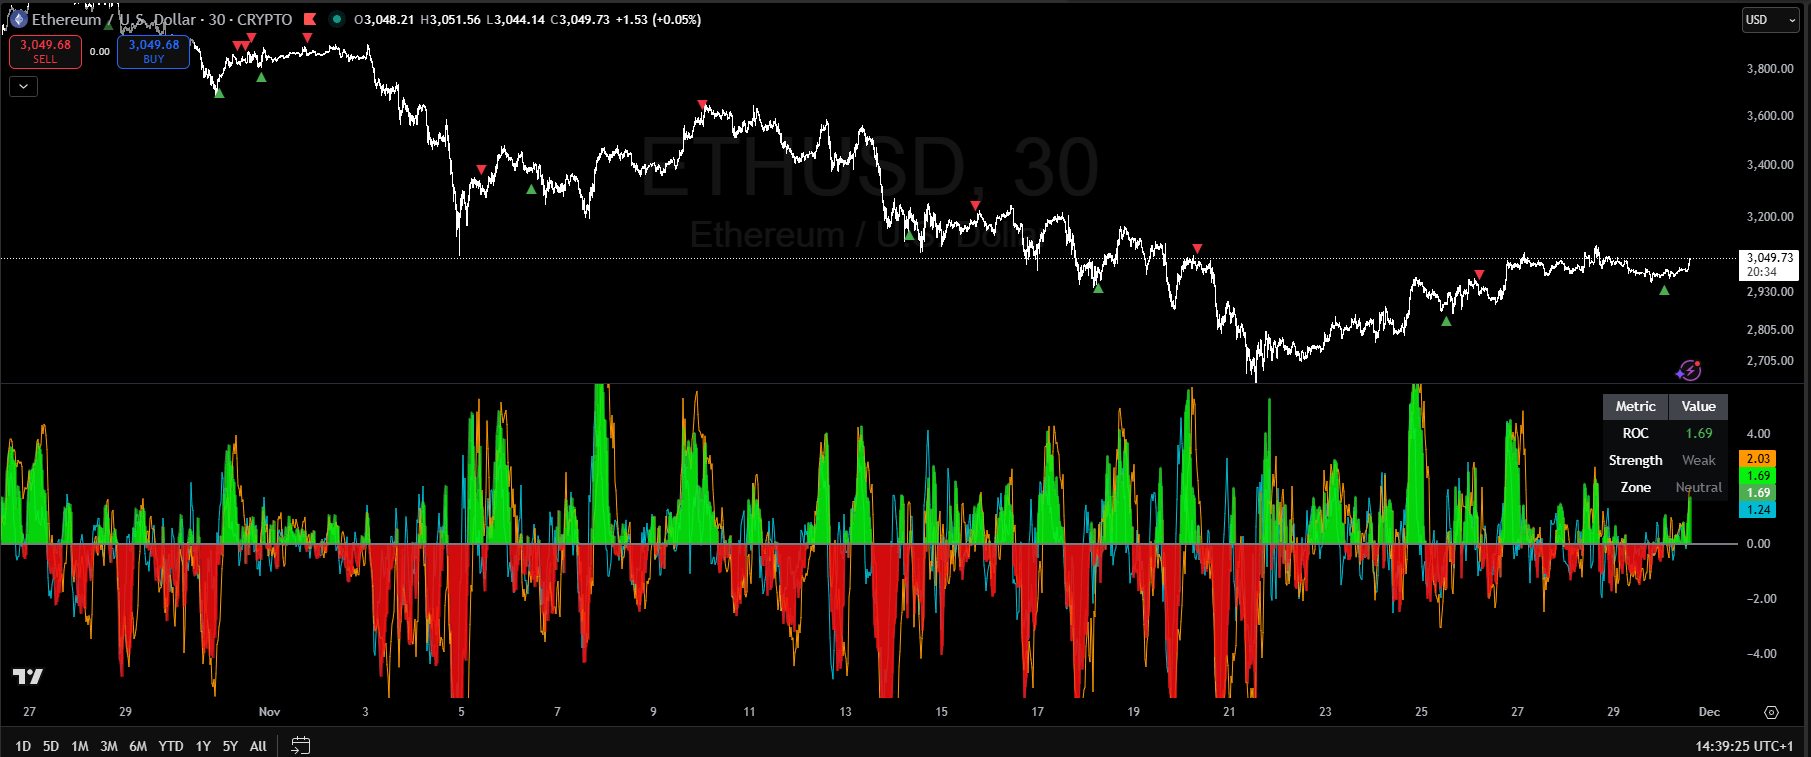
The Advanced ROC indicator displays a green/red histogram with integrated metrics table showing ROC = 1.69, Strength = Weak (orange), Zone = Neutral (green). Green histogram bars above +3.00 indicate overbought momentum extremes, red bars below -3.00 indicate oversold extremes. The table provides instant trend classification without manual calculation.
Advanced ROC Suite validates momentum by analyzing trend consistency across multiple timeframes. Strong momentum on RSI means nothing if ROC shows the trend is decelerating.
Multi-Period ROC Analysis
The indicator calculates ROC across three periods simultaneously:
Core ROC Formula:
ROC = ((Current Price - Price N periods ago) / Price N periods ago) × 100Three-Period Configuration:
- Fast ROC (7 periods): Captures short-term momentum shifts
- Medium ROC (14 periods): Primary momentum gauge
- Slow ROC (21 periods): Longer-term trend confirmation
ROC Trend Strength Classification
Note: ROC values are percentages, typically ranging from -6% to +6% in normal market conditions. The classification below is based on direction (positive/negative), not absolute values.
All 3 Periods Positive (Strong):
- ROC_Fast > 0 AND ROC_Medium > 0 AND ROC_Slow > 0
- Signal: Strong multi-timeframe trend confirmation
- Action: Proceed with entry if other conditions met
2/3 Periods Positive (Moderate):
- Any 2 of 3 ROC values positive
- Signal: Moderate trend, proceed with caution
- Action: Reduce position size
1/3 Periods Positive (Weak):
- Only 1 ROC value positive
- Signal: Weak/conflicting trend
- Action: Avoid entry or minimal position
All Negative (No Entry):
- All ROC values negative
- Signal: Downtrend across all timeframes
- Action: Do not enter long positions
ROC Acceleration Analysis
Accelerating Momentum:
- ROC_Fast > ROC_Medium > ROC_Slow
- Multiplier: 1.2x (momentum strengthening)
Steady Momentum:
- ROC values similar (within 5% of each other)
- Multiplier: 1.0x (stable trend)
Decelerating Momentum:
- ROC_Fast < ROC_Medium < ROC_Slow
- Multiplier: 0.8x (momentum weakening, caution)
ROC Confirmation Assessment
Instead of a numerical score, use this simple checklist:
Strong Confirmation (Green Light):
- All 3 ROC periods positive
- ROC accelerating (Fast > Medium > Slow)
- Action: Full position size allowed
Moderate Confirmation (Yellow Light):
- 2/3 ROC periods positive
- ROC steady or mixed
- Action: Reduce position size by 50%
Weak/No Confirmation (Red Light):
- 1/3 or fewer ROC periods positive
- ROC decelerating or all negative
- Action: Do not enter
Volume-Weighted ROC
The indicator includes volume weighting for higher-conviction signals:
Volume Weight = Current Volume / Average Volume (14 periods)
ROC Volume-Weighted = Medium ROC × Volume Weight
When volume is 2x average, momentum signals carry 2x weight.
Component 3: Sortino Risk Filter — Downside Protection
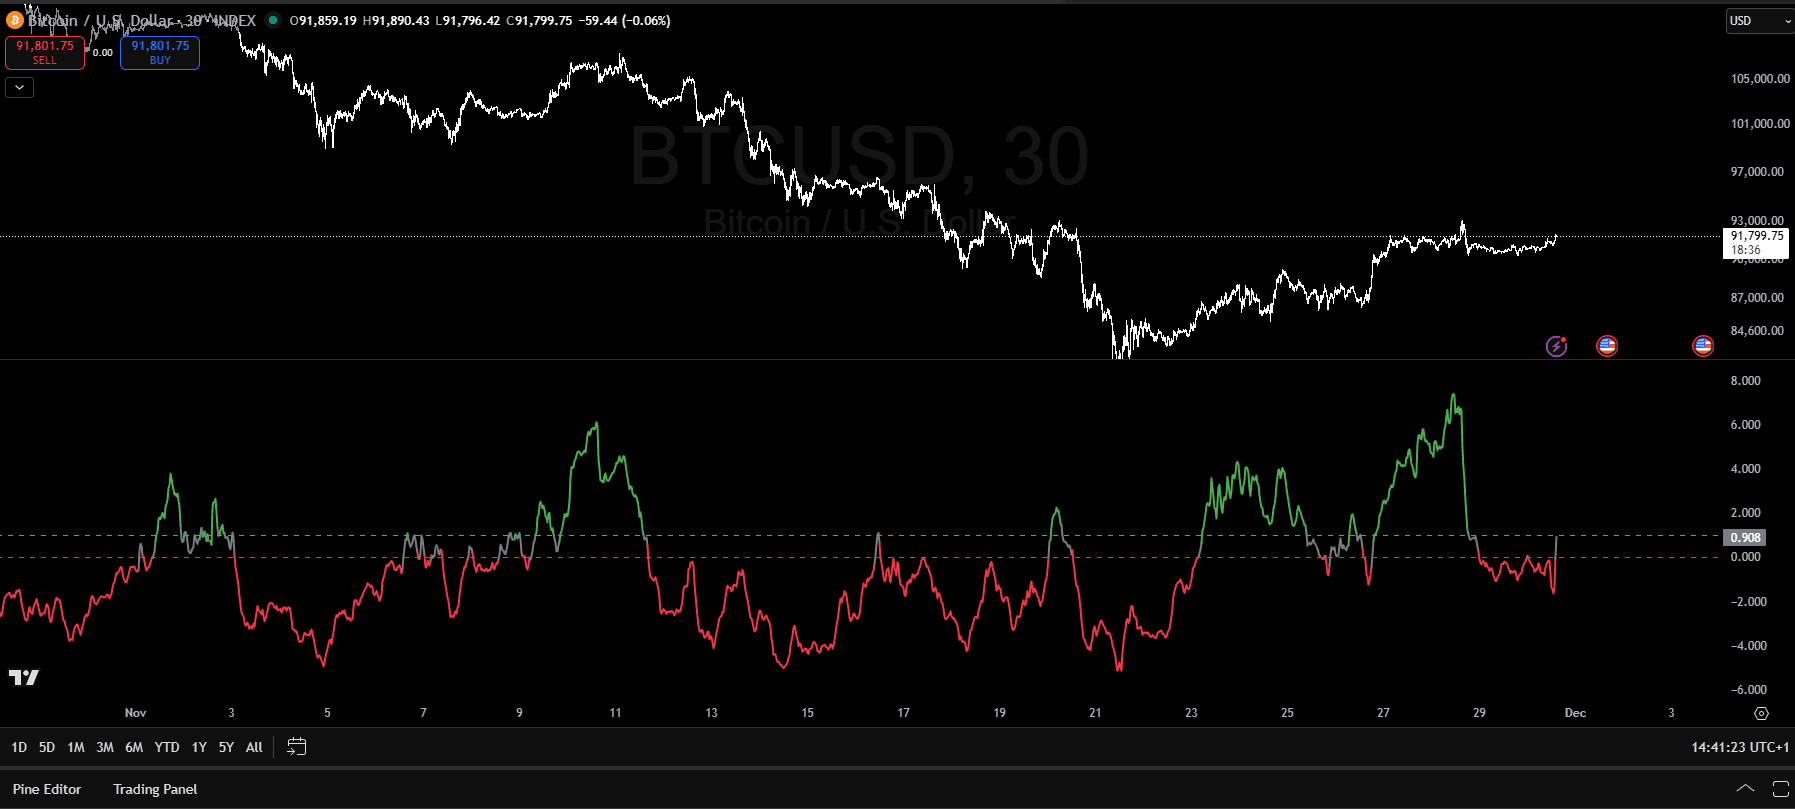
Sortino Ratio indicator displaying risk-adjusted return measurement. Green coloring indicates Sortino above the strong threshold (good downside protection), gray indicates acceptable range, red indicates poor risk-adjustment. The indicator filters momentum signals by measuring return per unit of downside risk—only penalizing losses, not upside volatility.
The Sortino Ratio is the critical filter that separates good momentum from bad. It measures return per unit of downside risk—only penalizing losses, not upside volatility.
What Sortino Measures
Core Sortino Formula:
Sortino Ratio = (Mean Return - Risk-Free Rate) / Downside Deviation × √Annualization FactorWhere Downside Deviation only includes returns below the target (typically 0%).
Why Sortino Over Sharpe for Momentum
Sharpe Ratio penalizes ALL volatility equally—including upside moves that traders want. In momentum trading, you WANT upside volatility.
Sortino only penalizes downside volatility, making it the perfect filter for momentum strategies where you're seeking asymmetric gains.
Momentum-Specific Sortino Thresholds
IMPORTANT: RSI > 70 = OVERBOUGHT = DO NOT BUY
When RSI exceeds 70, the asset is overbought and likely to reverse. This is NOT a buy signal—it's a warning to avoid entry or take profits.
Optimal Entry Zone (RSI 40-60):
- Minimum Sortino: 1.5
- Rationale: Pullback in uptrend, best risk/reward entry point
Moderate Momentum (RSI 50-70):
- Minimum Sortino: 1.5
- Rationale: Standard risk threshold, acceptable entry
Weak Momentum (RSI < 40):
- Minimum Sortino: 2.0
- Rationale: Weak momentum requires exceptional risk profile
Overbought (RSI > 70):
- Action: DO NOT ENTER new positions
- Rationale: Too late to buy, high reversal risk, consider taking profits on existing positions
Sortino Color Coding
The indicator uses dynamic coloring:
- Green: Sortino > Strong Threshold (excellent downside protection)
- Gray: Between thresholds (acceptable)
- Red: Sortino < Weak Threshold (poor downside protection, avoid)
Important Note on Thresholds
The thresholds presented (Sortino > 1.5, RSI 40-60, etc.) are general guidelines that work well on average across most crypto assets. However, optimal thresholds vary by asset class, market conditions, and volatility regime. Some assets may perform better with Sortino > 1.2, others may require > 2.0. Backtest and optimize thresholds for your specific trading universe. These guidelines provide a solid starting point, but always validate against your own data.
The Integration Framework: Combining All Three Indicators
Now that you understand Momentum RSI, Advanced ROC, and Sortino individually, here's how to combine them for trading decisions.
Simple Checklist Approach (Recommended)
Instead of complex numerical scores, use this practical checklist:
✅ Momentum RSI Check:
- Is RSI in optimal zone (40-60)? → Green light
- Is RSI acceptable (50-70)? → Yellow light
- Is RSI overbought (>70) or weak (<40)? → Red light
✅ ROC Confirmation Check:
- All 3 ROC periods positive + accelerating? → Green light
- 2/3 ROC periods positive? → Yellow light
- 1/3 or fewer positive? → Red light
✅ Sortino Filter Check:
- Sortino > 1.5? → Green light
- Sortino 1.0-1.5? → Yellow light
- Sortino < 1.0? → Red light (DO NOT ENTER)
Position Sizing Based on Checklist
| Green Lights | Position Size |
|---|---|
| 3 Green | 100% of base (5% portfolio) |
| 2 Green, 1 Yellow | 75% of base (3.75%) |
| 1 Green, 2 Yellow | 50% of base (2.5%) |
| Any Red Light | NO ENTRY |
Key Rules:
- Sortino Red Light = Automatic NO ENTRY (non-negotiable)
- RSI Overbought (>70) = Automatic NO ENTRY
- All ROC negative = Automatic NO ENTRY
Entry and Exit Rules
Entry Conditions (ALL must be met)
- RSI Check: RSI 40-60 (optimal zone = green light)
- ROC Check: All 3 periods positive (= green light)
- Sortino Check: Sortino > 1.5 (= green light)
- No Divergence: No bearish divergence on RSI or ROC
- Position Size: Based on green light count (3 green = full, 2 green = 75%, any red = no entry)
Exit Conditions (ANY triggers exit)
- Sortino Breakdown: Sortino drops below 1.0 (red light)
- ROC Reversal: All three ROC periods turn negative (red light)
- Bearish Divergence: RSI or ROC shows bearish divergence
- RSI Overbought: RSI > 80 (overextended, take profits)
Implementation Checklist
Indicators Required (TradingView):
- Momentum / RSI → Profabighi Capital
- Advanced ROC Suite → Profabighi Capital
- Sortino Ratio → Profabighi Capital
Recommended Settings:
- Momentum / RSI: Momentum Period=10, RSI Period=14, Show Smoothed RSI=true (for RSI mode)
- Advanced ROC: Fast=7, Medium=14, Slow=21, OB=10, OS=-10
- Sortino: CalcPeriod=90, SmoothPeriod=3, StrongThreshold=1.0, WeakThreshold=0.0
Daily Workflow:
- Scan for RSI in optimal zone (40-60)
- Check if all 3 ROC periods are positive
- Verify Sortino > 1.5
- Count green lights on checklist
- Size position based on green light count
- Set stop loss based on Sortino level
- Monitor for exit conditions (any red light)
Common Mistakes to Avoid
1. Ignoring Sortino Deterioration
- Mistake: Entering because RSI/ROC look good, ignoring low Sortino
- Impact: Entering positions with poor risk-adjustment
- Solution: Never override Sortino filter
2. Buying When RSI is Overbought (> 70)
- Mistake: Entering when RSI > 70 (overbought zone)
- Impact: Buying exhausted moves near tops with high reversal risk
- Solution: Wait for RSI to pull back to 40-60 (optimal entry zone) before entering
3. Holding Positions After RAMS Deteriorates
- Mistake: "It will come back" mentality when RAMS drops
- Impact: Small winners become big losers
- Solution: Exit when RAMS < 50, no exceptions
4. Position Sizing Based on Conviction Instead of RAMS
- Mistake: "I really like this one" = bigger position
- Impact: Emotional position sizing, inconsistent results
- Solution: Strict RAMS-based position sizing formula
Key Principles
- Momentum without risk-adjustment is gambling — Always filter momentum signals through Sortino
- Multi-timeframe confirmation reduces false signals — Require ROC alignment across periods
- Position sizing creates consistency — Use the checklist, not emotions
- Exit discipline equals entry discipline — Follow exit rules as strictly as entry rules
- Thresholds are guidelines, not absolutes — Optimize per asset and market conditions; what works for BTC may differ from altcoins
Indicators Used:
- Momentum / RSI → Profabighi Capital (Two-layer momentum analysis: RSI applied to Momentum with multiple smoothing options)
- Advanced ROC Suite → Profabighi Capital (Multi-period trend confirmation with divergence detection)
- Sortino Ratio → Profabighi Capital (Downside risk assessment with dynamic thresholds)
All available on TradingView.
Related Articles
- Portfolio Efficiency Optimizer: Multi-Asset Risk Analysis
- Relative Performance Matrix: Cross-Asset Comparison Framework
- Risk Psychology: Understanding Trading Behavior
- Trading Journal Mastery: The Psychology Behind Effective Trade Logging
Disclaimer: This content is for educational purposes only and does not constitute financial advice. Trading cryptocurrencies involves substantial risk of loss. Always do your own research and never risk more than you can afford to lose.